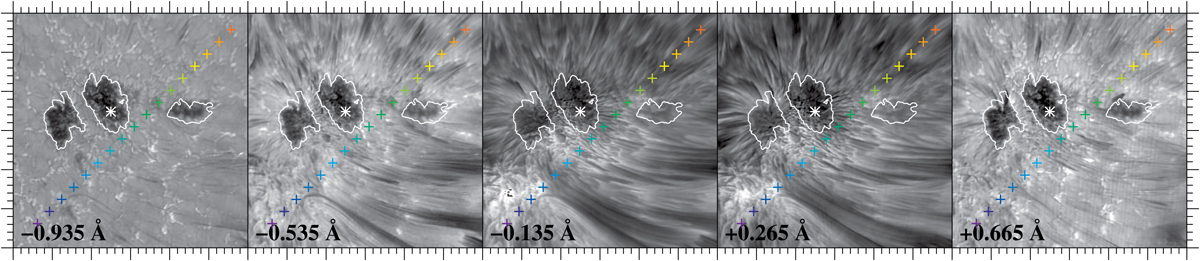
Fig. 4.
Download original image
Speckle-restored Hα filtergrams of each wavelength point of the Hα line scan at 18:03 UT on 2015 April 1. The wavelength positions with respect to the Hα line core are given in the lower left corner of each panel. Neighboring wavelength points are separated by 0.4 Å. The ROI has a size of 30″ × 30″. The colored crosses indicate the location of extracted Hα line profiles shown in Fig. 5. The white asterisk within pore P2 indicates the position of the thin, solid black line profile shown in Fig. 5. The white contours outlining the pores are based on the average image of the first time series of TiO images and are computed using an intensity threshold of 0.8. An animated version of this figure is available online.
Current usage metrics show cumulative count of Article Views (full-text article views including HTML views, PDF and ePub downloads, according to the available data) and Abstracts Views on Vision4Press platform.
Data correspond to usage on the plateform after 2015. The current usage metrics is available 48-96 hours after online publication and is updated daily on week days.
Initial download of the metrics may take a while.