Fig. 10.
Download original image
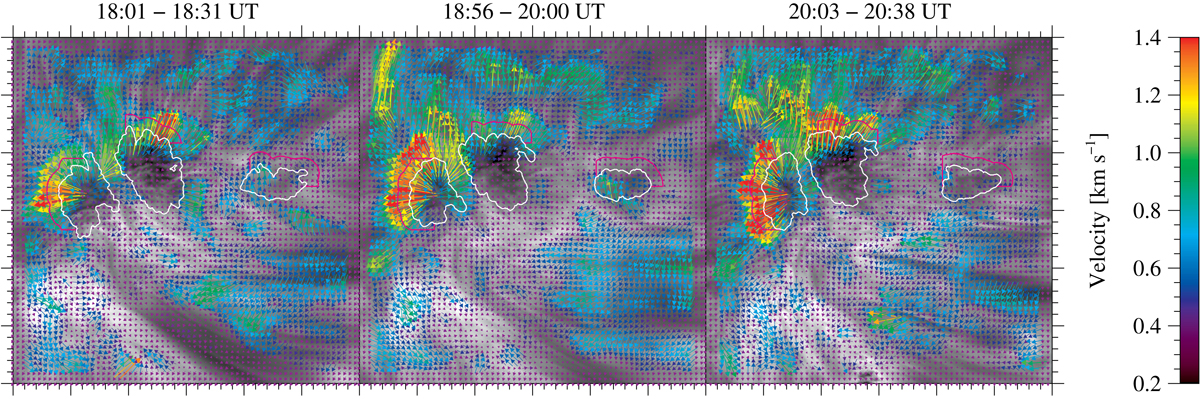
2D LCT maps with an ROI of 30″ × 30″ show the chromospheric horizontal proper motions for the three time periods indicated above each panel. Rainbow-colored arrows refer to magnitude and direction of the average flow vectors, superposed on a time-averaged Hα line-core filtergram. The white contours outline the pores in the corresponding TiO images for intensities lower than 0.8, while the pink contours delineate the regions for which the inflow velocities are computed.
Current usage metrics show cumulative count of Article Views (full-text article views including HTML views, PDF and ePub downloads, according to the available data) and Abstracts Views on Vision4Press platform.
Data correspond to usage on the plateform after 2015. The current usage metrics is available 48-96 hours after online publication and is updated daily on week days.
Initial download of the metrics may take a while.