Fig. 1.
Download original image
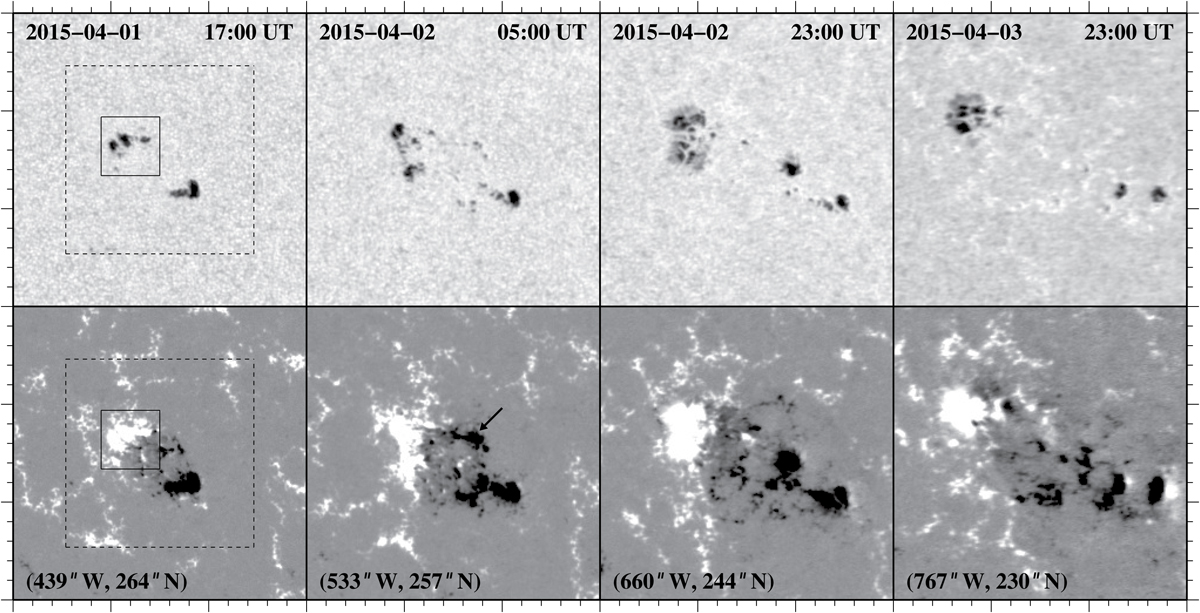
HMI Continuum images (top) and LOS magnetograms (bottom) showing the evolution of active region NOAA 12317 from 17:00 UT on 2015 April 1 (left) to 17:00 UT on 2015 April 3 (right). The FOV covers 150″ × 150″, and the coordinates in the lower left corners refer to the FOV’s center. The black solid squares in the left panels correspond to an ROI of 30″ × 30″, which is used in the analysis of the high-resolution Hα and TiO time series. Dashed squares correspond to an ROI of 95″ × 95″ which is used in the determination of the photometric area and magnetic flux shown in Fig. 6. An arrow in second-lower panel indicates the negative polarity pore belonging to the secondary flux system. Magnetograms are displayed in the range ±400 G. An animated version of this figure is available online.
Current usage metrics show cumulative count of Article Views (full-text article views including HTML views, PDF and ePub downloads, according to the available data) and Abstracts Views on Vision4Press platform.
Data correspond to usage on the plateform after 2015. The current usage metrics is available 48-96 hours after online publication and is updated daily on week days.
Initial download of the metrics may take a while.