Fig. 6.
Download original image
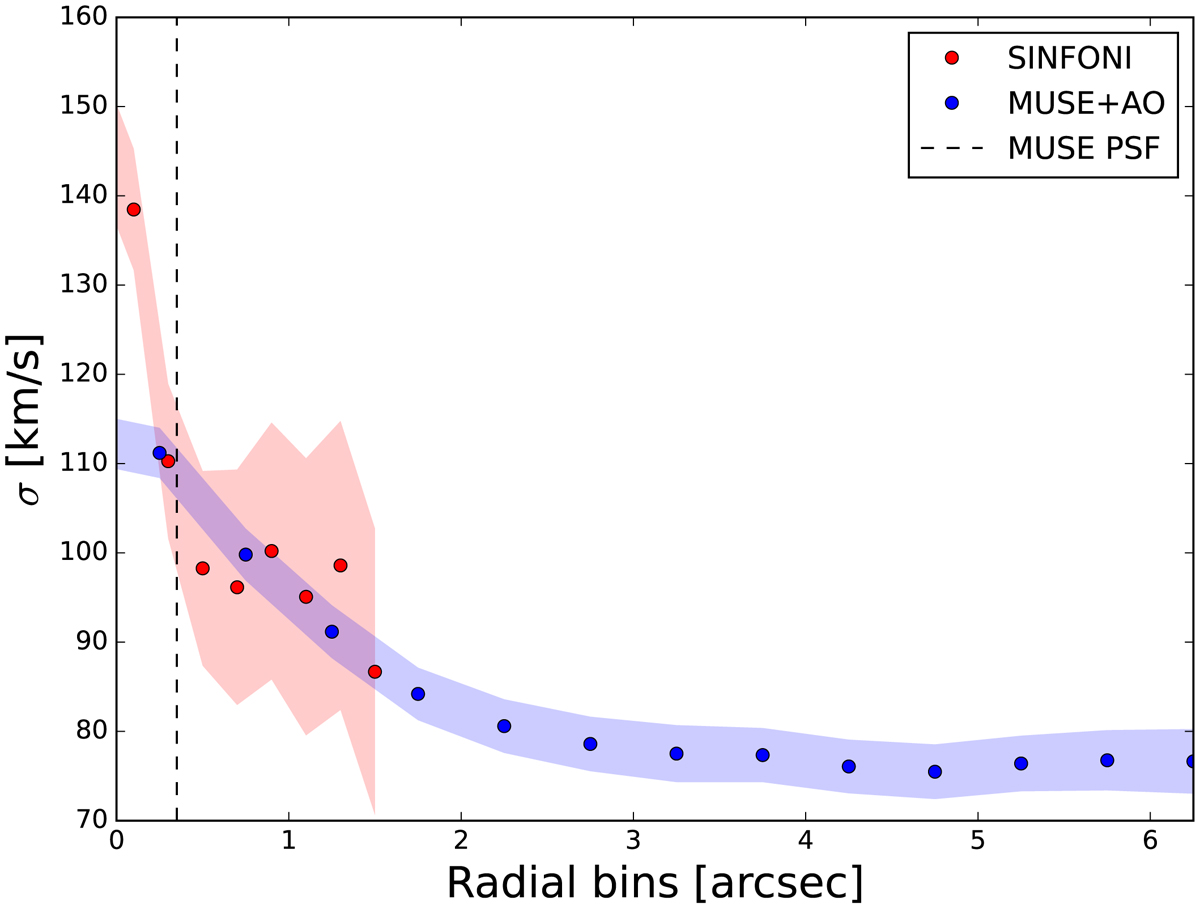
Radial comparison of the velocity dispersion derived for the two different IFU data sets. The values were averaged within circular annuli around the kinematic centre. The error range of the averaged values in the radial bins are calculated via error propagation and are shown as shaded regions. SINFONI and MUSE maps match well for radii larger than the MUSE PSF (0.7″ FWHM).
Current usage metrics show cumulative count of Article Views (full-text article views including HTML views, PDF and ePub downloads, according to the available data) and Abstracts Views on Vision4Press platform.
Data correspond to usage on the plateform after 2015. The current usage metrics is available 48-96 hours after online publication and is updated daily on week days.
Initial download of the metrics may take a while.