Open Access
Fig. 5.
Download original image
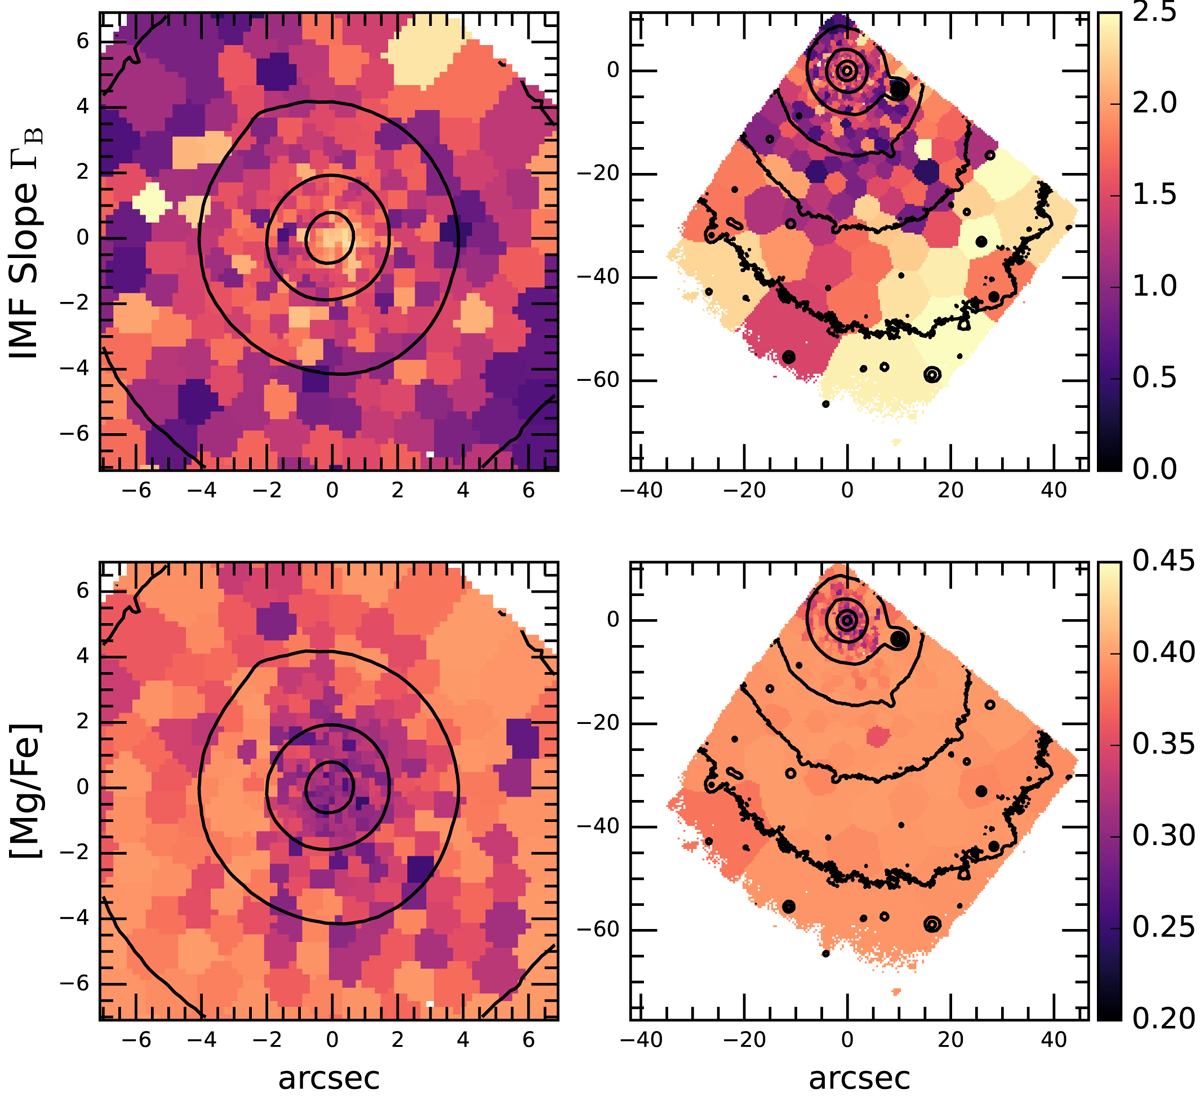
[Mg/Fe] and IMF slope maps ΓB of FCC 47. Left and right: maps extracted from the MUSE observations shown within a zoom onto the centre and across the full MUSE FoV. The NSC of FCC 47 has a larger IMF slope and lower alpha-element abundance.
Current usage metrics show cumulative count of Article Views (full-text article views including HTML views, PDF and ePub downloads, according to the available data) and Abstracts Views on Vision4Press platform.
Data correspond to usage on the plateform after 2015. The current usage metrics is available 48-96 hours after online publication and is updated daily on week days.
Initial download of the metrics may take a while.