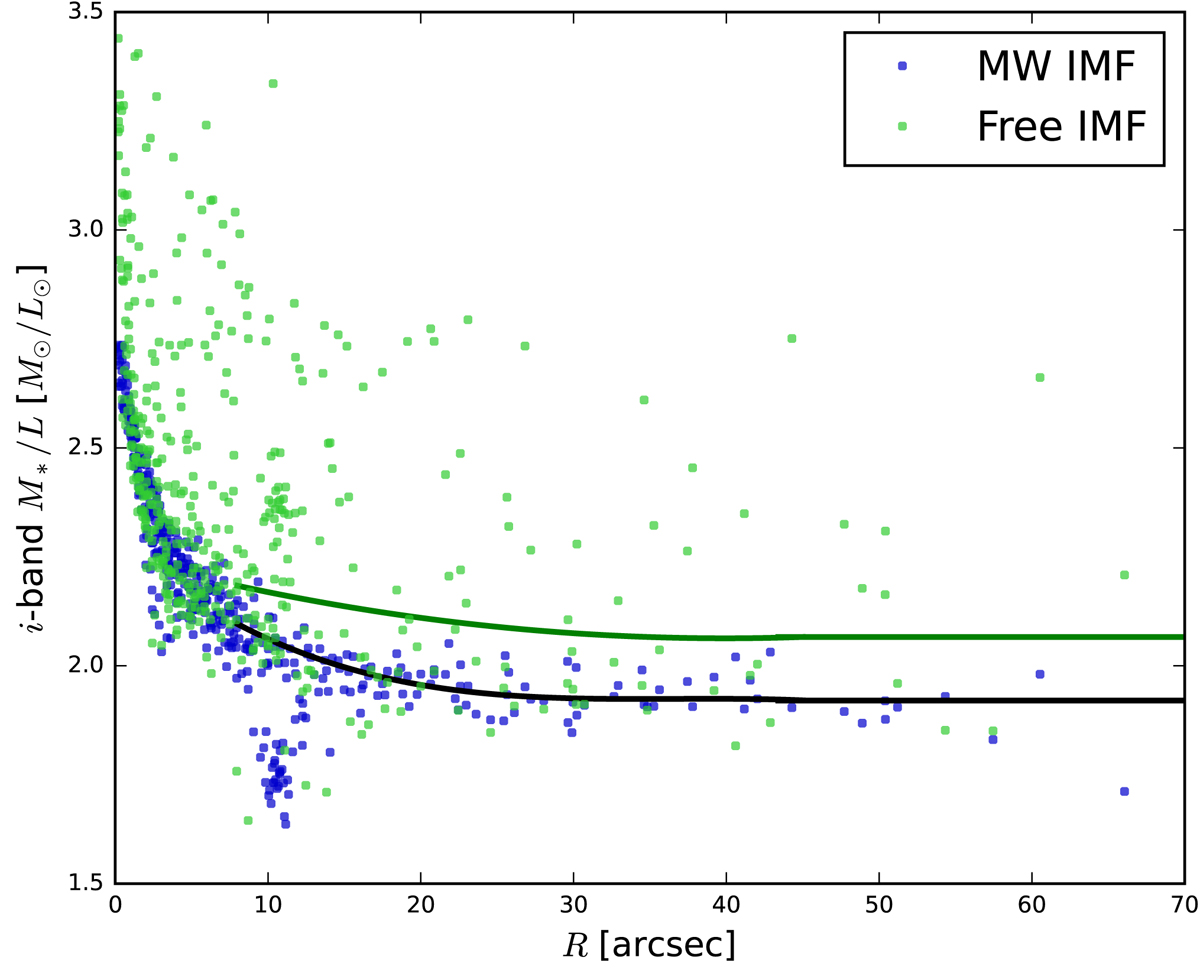
Fig. 4.
Download original image
Stellar mass-to-light ratio (M*/L) profiles in the i-band. Each point is a Voronoi bin as shown in Fig. 2. The blue points correspond to the left maps in Fig. 2, while the green points correspond to the maps on the right. We combined our M*/L maps with the HST image to derive mass maps. As the HST image has a larger coverage than the MUSE data, we had to partially interpolate the M*/L values. The lines show the interpolated values used outside of the MUSE coverage (R > 8 arcsec; see explanation in Sect. 3.2 and Fig. C.1).
Current usage metrics show cumulative count of Article Views (full-text article views including HTML views, PDF and ePub downloads, according to the available data) and Abstracts Views on Vision4Press platform.
Data correspond to usage on the plateform after 2015. The current usage metrics is available 48-96 hours after online publication and is updated daily on week days.
Initial download of the metrics may take a while.