Fig. 3.
Download original image
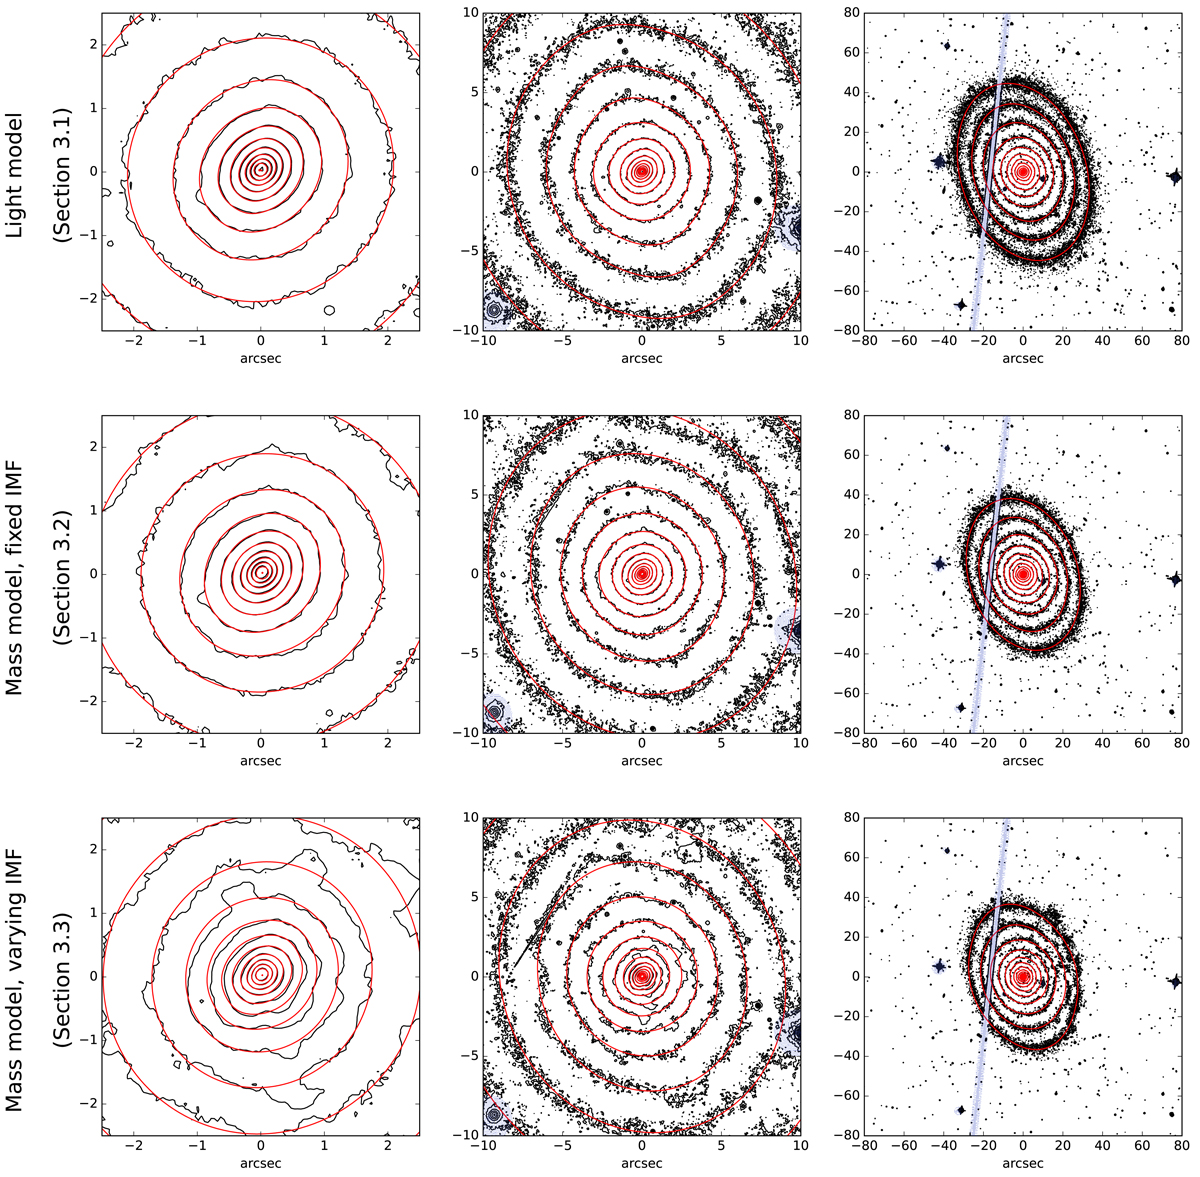
Overview of the light and mass models used in this paper. Top: isophotes of the HST/ACS F850LP band imaging data of FCC 47 (black) overplotted with the MGE model from Sect. 3.1 (red). Middle: mass map derived by multiplying the luminosity in the HST/ACS F850LP image with the M*, MW-IMF/L (fixed IMF) shown in the left panels of Fig. 2. Overplotted is the MGE model from Sect. 3.2 (red). Bottom: mass map derived by multiplying the luminosity in the HST/ACS F850LP image with the M*, free-IMF/L (varying IMF) shown in the right panels of Fig. 2. Overplotted is the MGE model from Sect. 3.3 (red). From left to right, we show a cut-out of the central 5 × 5 arcsec that is dominated by the NSC, a zoom out to 20″ × 20″, and a zoom out to 160″ × 160″ covering the full galaxy. Masked regions are shaded in grey. Only for this visualisation, the ACS image and the MGE were rotated such that North is aligned with the y-axis.
Current usage metrics show cumulative count of Article Views (full-text article views including HTML views, PDF and ePub downloads, according to the available data) and Abstracts Views on Vision4Press platform.
Data correspond to usage on the plateform after 2015. The current usage metrics is available 48-96 hours after online publication and is updated daily on week days.
Initial download of the metrics may take a while.