Fig. 2.
Download original image
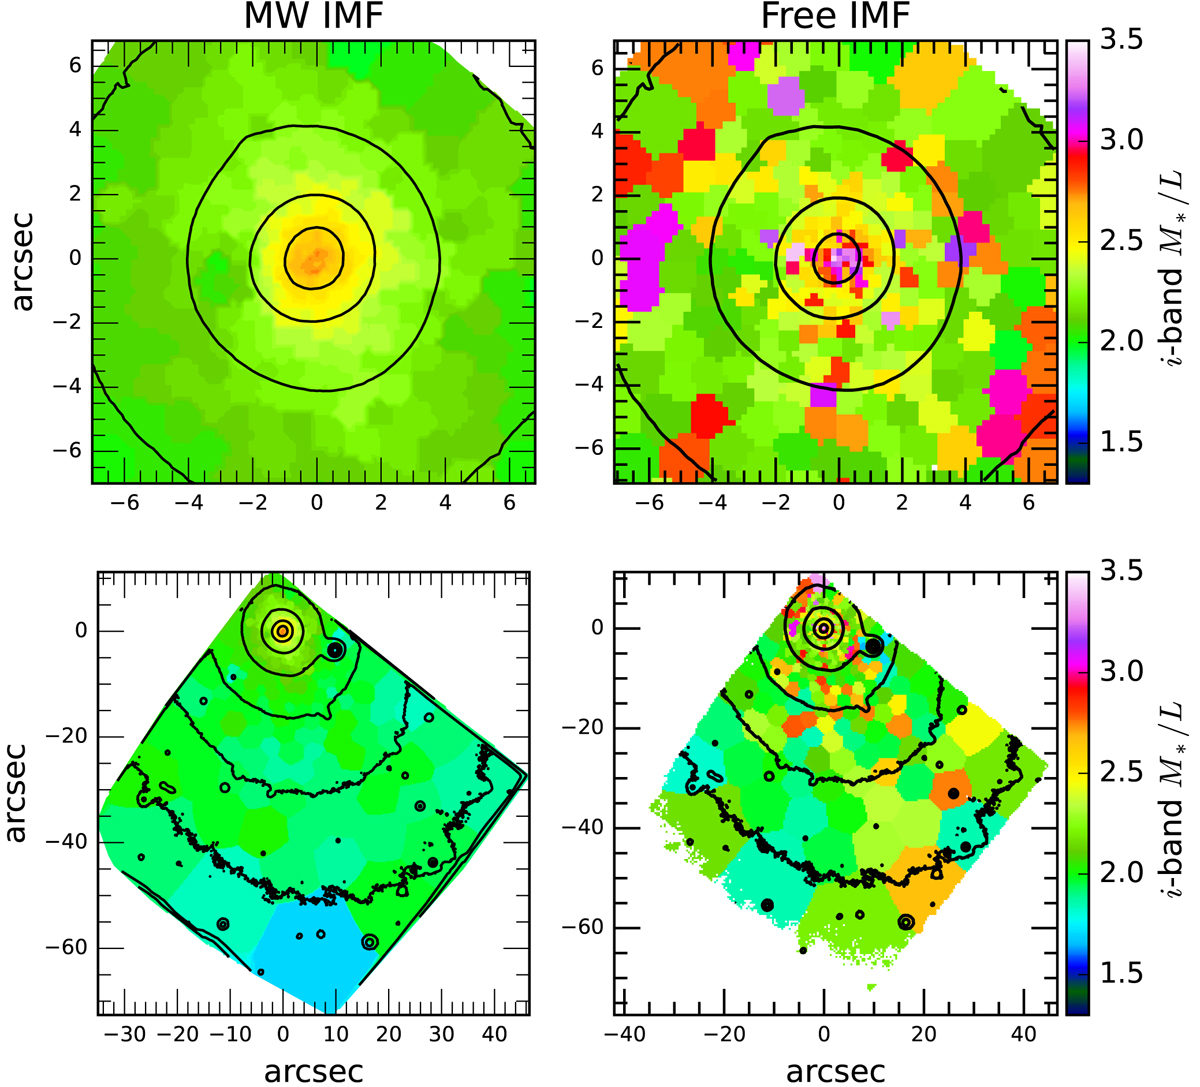
Stellar mass-to-light ratio (M*/L) maps in the i-band derived from stellar population models fit to the MUSE observations. The left and right panels show the effect of different IMF assumptions. Left: M*, MW-IMF/L map derived from stellar population synthesis assuming a MW-like IMF (see Sect. 3.2). Right: M*, free-IMF/L map derived using a varying IMF but not allowing for IMF slopes lower than 0.8 (see Sect. 3.3). Top and bottom: M*/Li map extracted from the MUSE observations shown within a zoom onto the centre of and across the full MUSE FoV, respectively. The M*/L is significantly higher in the centre of FCC 47 – where the NSC is located – than in the rest of the galaxy. For comparison, the dynamical model with constant mass-to-light ratio M*, const/L is best fitted with 1.82 M⊙/L⊙ (see Sect. 4). Radial profiles of these maps are shown in Fig. 4.
Current usage metrics show cumulative count of Article Views (full-text article views including HTML views, PDF and ePub downloads, according to the available data) and Abstracts Views on Vision4Press platform.
Data correspond to usage on the plateform after 2015. The current usage metrics is available 48-96 hours after online publication and is updated daily on week days.
Initial download of the metrics may take a while.