Fig. 12.
Download original image
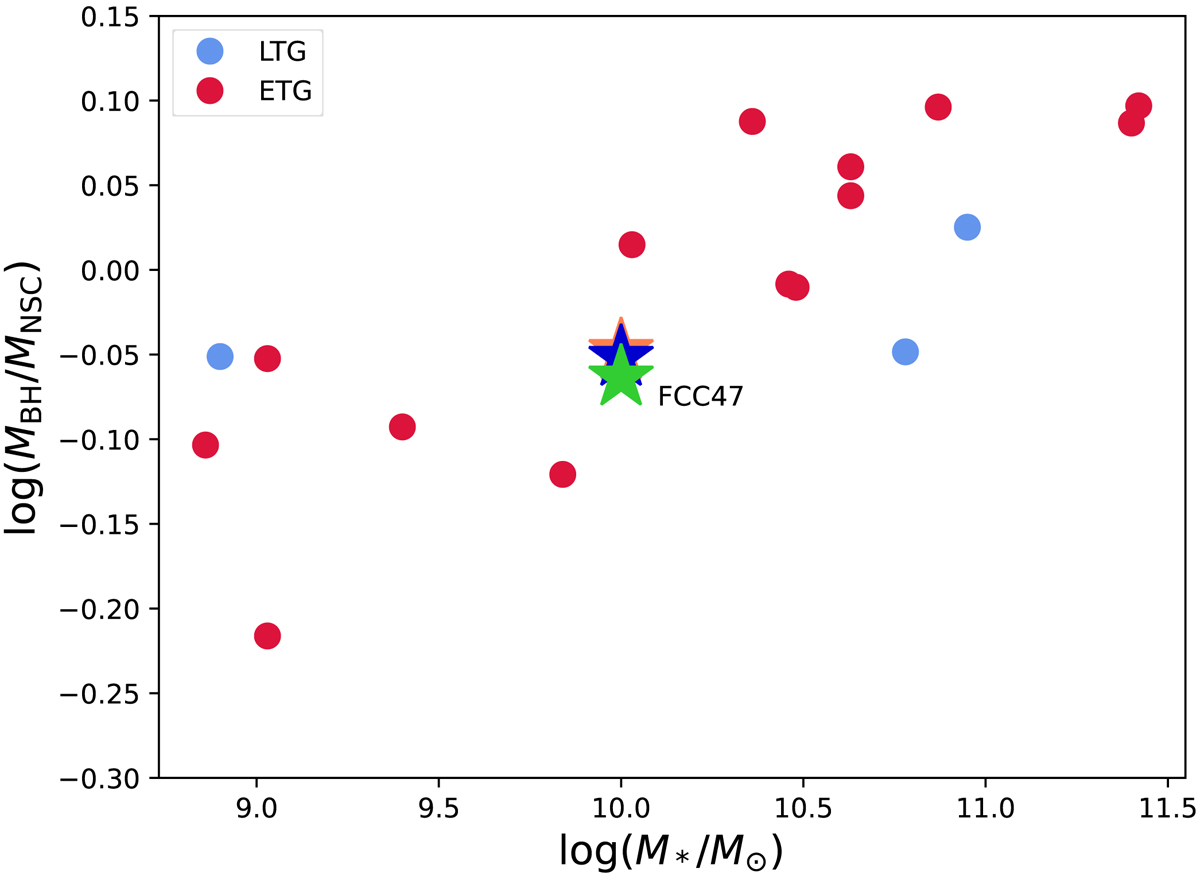
Ratio of the central black hole mass and the NSC mass plotted against their host galaxy stellar mass. The figure is adapted from Neumayer et al. (2020). We only plot galaxies that have a robust measurement in both black hole and NSC mass. The colours indicate the galaxy type: red for ETGs and blue for LTGs. For the ETG FCC 47, the colours have the same significations as in Fig. 11.
Current usage metrics show cumulative count of Article Views (full-text article views including HTML views, PDF and ePub downloads, according to the available data) and Abstracts Views on Vision4Press platform.
Data correspond to usage on the plateform after 2015. The current usage metrics is available 48-96 hours after online publication and is updated daily on week days.
Initial download of the metrics may take a while.