Fig. 10.
Download original image
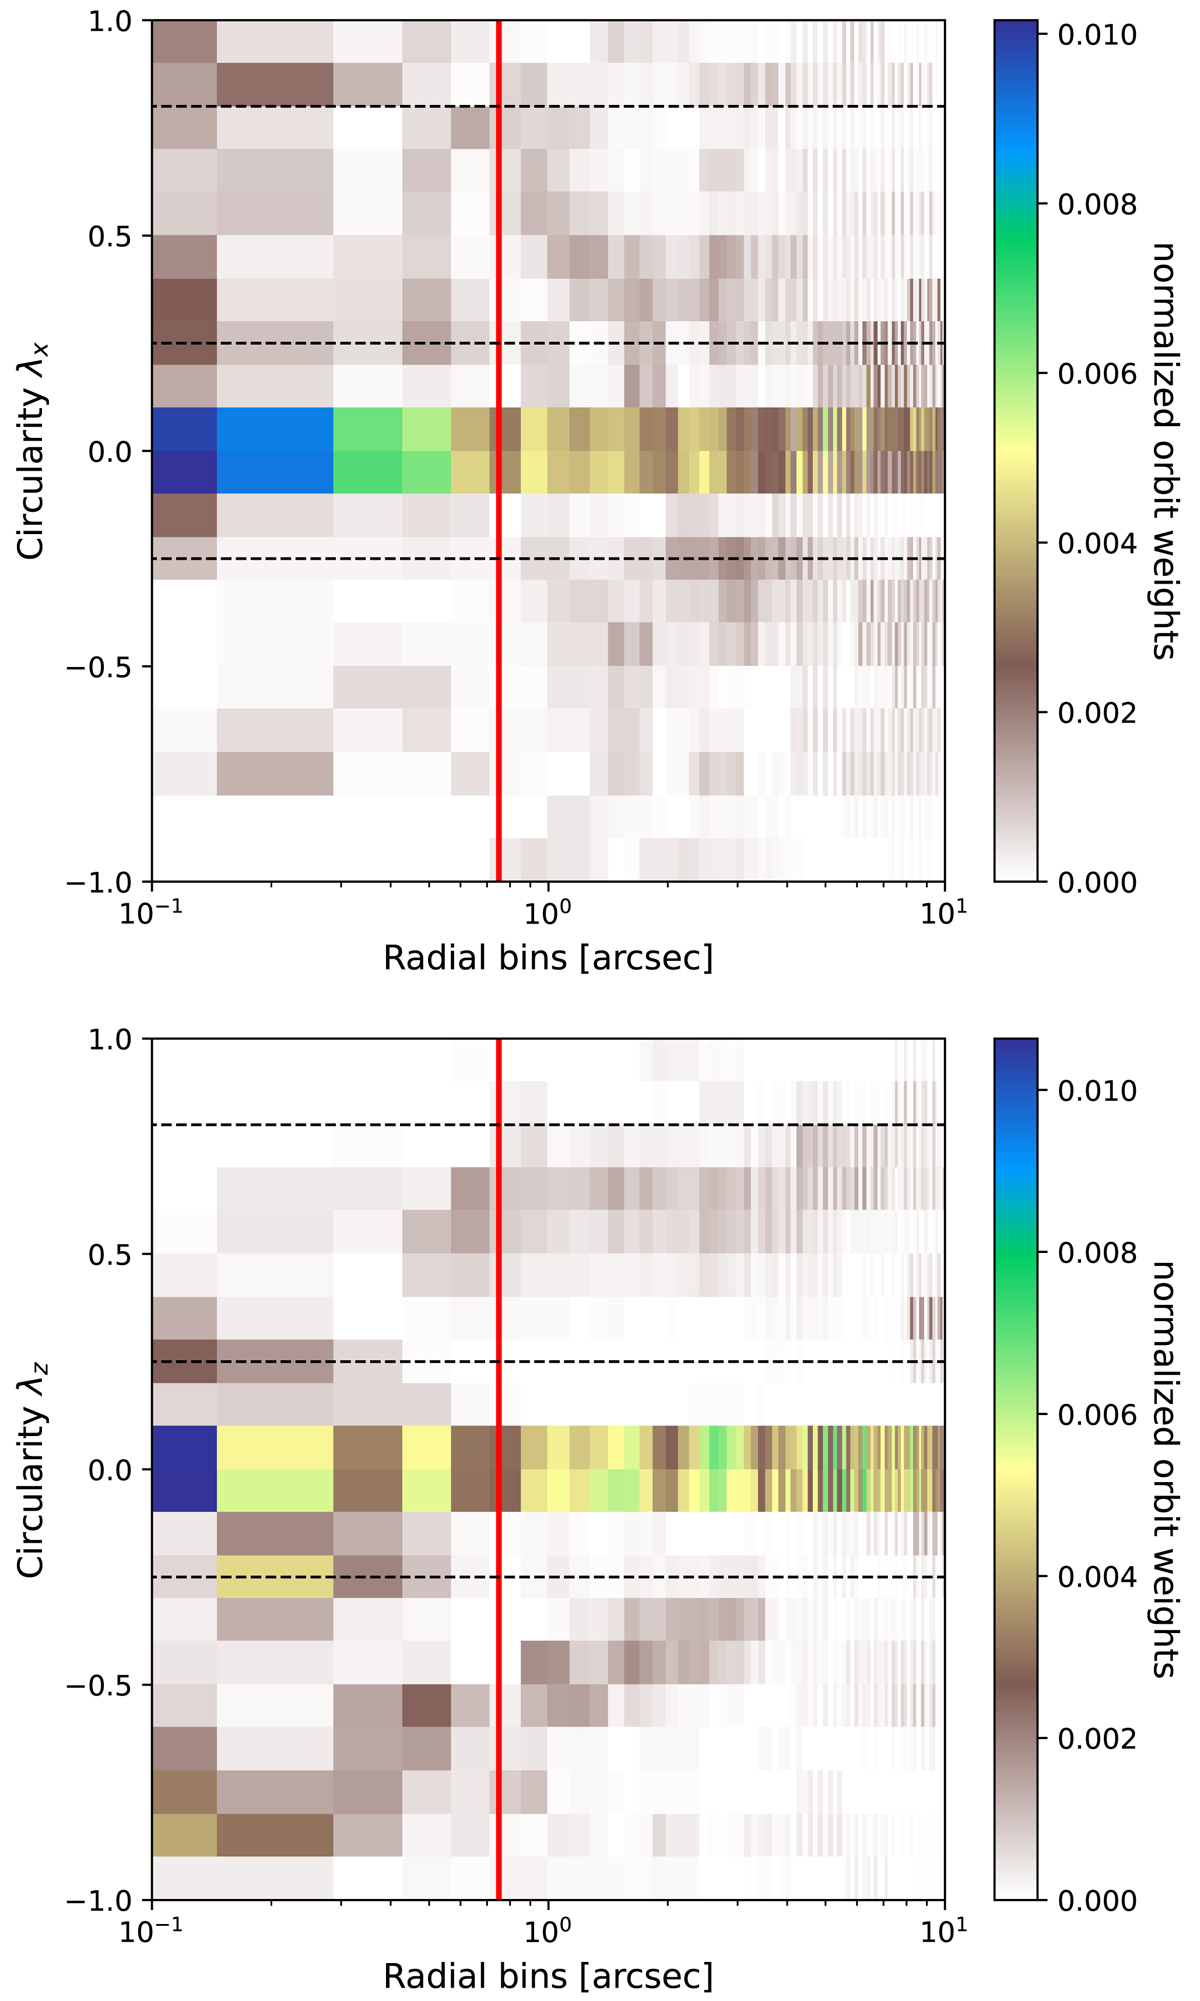
Averaged orbit circularity distribution of the ten best-fit models along the long (top) and short (bottom) galaxy axis. The colour indicates the weight of the orbits in phase-space. The dashed lines separate the distribution into cold (λz > 0.8), warm (0.25 < λz < 0.8), hot (|λz|< 0.25), and counter-rotating orbits (λz < −0.25). The red vertical line indicates the effective radius of the NSC.
Current usage metrics show cumulative count of Article Views (full-text article views including HTML views, PDF and ePub downloads, according to the available data) and Abstracts Views on Vision4Press platform.
Data correspond to usage on the plateform after 2015. The current usage metrics is available 48-96 hours after online publication and is updated daily on week days.
Initial download of the metrics may take a while.