Fig. 6
Download original image
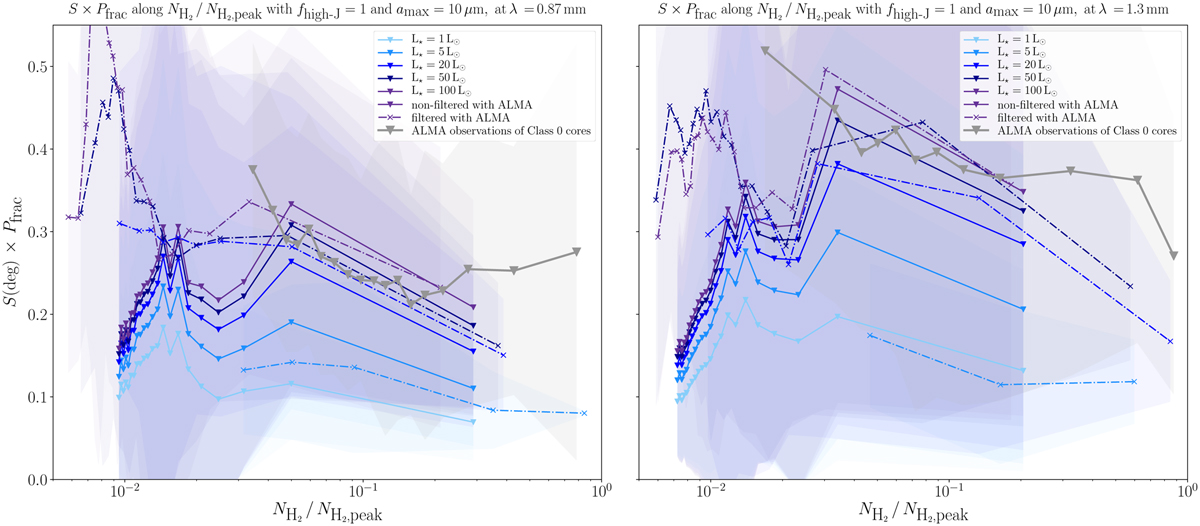
Comparison of the evolution of 𝒮 × Ƥfrac as a function of normalized column density, ![]() , between ALMA observations and our models, before and after spatial filtering. The left (right) panel corresponds to the results of the radiative transfer performed at 0.87 mm (1.3 mm). The distributions of 𝒮 × Ƥfrac values from our models are in different tints of blue, while the distributions of 𝒮 × Ƥfrac values from the ALMA observations presented in Le Gouellec et al. (2020) are in gray (where we split the 0.87 and 1.3 mm observations). The solid lines are the mean of the 𝒮 × Ƥfrac values in a given bin of normalized column density, and the corresponding shaded area represents the standard deviation. These two plots correspond to set III of the models (see Table 1), i.e., we fix fhigh−J = 1 and amax = 10 µm, and we vary L★ in the range 1.0, 5.0, 20, 50, 100 L⊙. The dashed colored lines correspond to the filtered models, and the solid lines are from the non-filtered models.
, between ALMA observations and our models, before and after spatial filtering. The left (right) panel corresponds to the results of the radiative transfer performed at 0.87 mm (1.3 mm). The distributions of 𝒮 × Ƥfrac values from our models are in different tints of blue, while the distributions of 𝒮 × Ƥfrac values from the ALMA observations presented in Le Gouellec et al. (2020) are in gray (where we split the 0.87 and 1.3 mm observations). The solid lines are the mean of the 𝒮 × Ƥfrac values in a given bin of normalized column density, and the corresponding shaded area represents the standard deviation. These two plots correspond to set III of the models (see Table 1), i.e., we fix fhigh−J = 1 and amax = 10 µm, and we vary L★ in the range 1.0, 5.0, 20, 50, 100 L⊙. The dashed colored lines correspond to the filtered models, and the solid lines are from the non-filtered models.
Current usage metrics show cumulative count of Article Views (full-text article views including HTML views, PDF and ePub downloads, according to the available data) and Abstracts Views on Vision4Press platform.
Data correspond to usage on the plateform after 2015. The current usage metrics is available 48-96 hours after online publication and is updated daily on week days.
Initial download of the metrics may take a while.