Fig. 4
Download original image
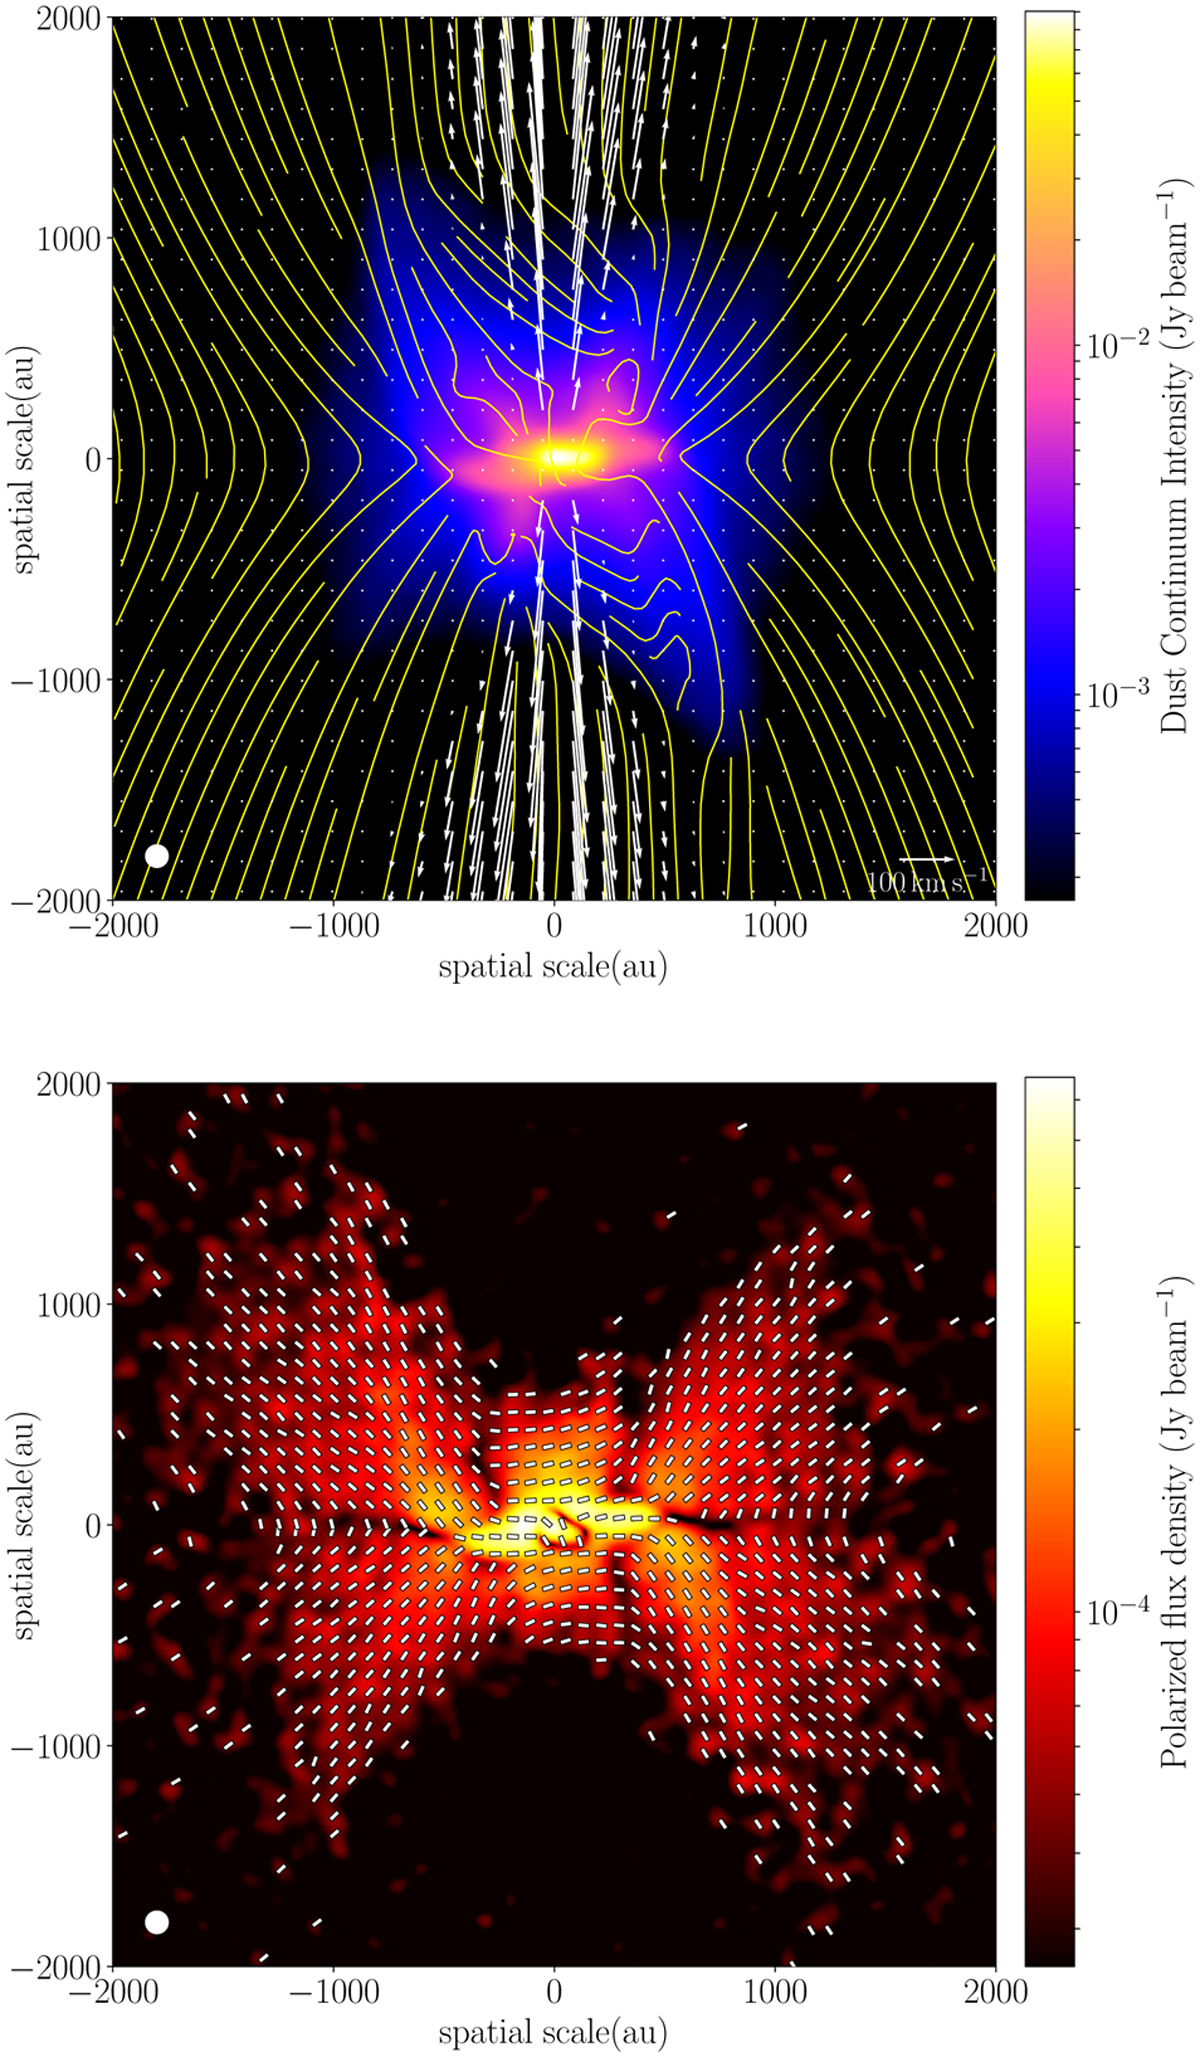
Dust polarization radiative transfer results performed at λ = 0.87 µm with fhigh−J = 1.0, L★=100 L⊙, and amax = 10 µm, after spatial filtering with the CASA simulator, mimicking ALMA interferometric observations. Top panel: synthetically observed dust continuum total intensity (Stokes I, color scale) plotted with the velocity field of the central slice in the MHD simulation (white arrows) and the density-weighted magnetic field lines (yellow lines). Stokes I is shown when I >3 σI, where σI = 0.10 mJy beam−1. Bottom panel: the color scale is the total linearly polarized intensity, which is shown where Ρ>3 σP, where σΡ = 10 µJy beam−1. The line segments represent the magnetic field orientations inferred from the dust polarization map. They are plotted where Ρ > 5 σΡ. The white circle at the bottom-left corner is the resolution of the ALMA synthetic observations and is 100 au in size.
Current usage metrics show cumulative count of Article Views (full-text article views including HTML views, PDF and ePub downloads, according to the available data) and Abstracts Views on Vision4Press platform.
Data correspond to usage on the plateform after 2015. The current usage metrics is available 48-96 hours after online publication and is updated daily on week days.
Initial download of the metrics may take a while.