Fig. 2
Download original image
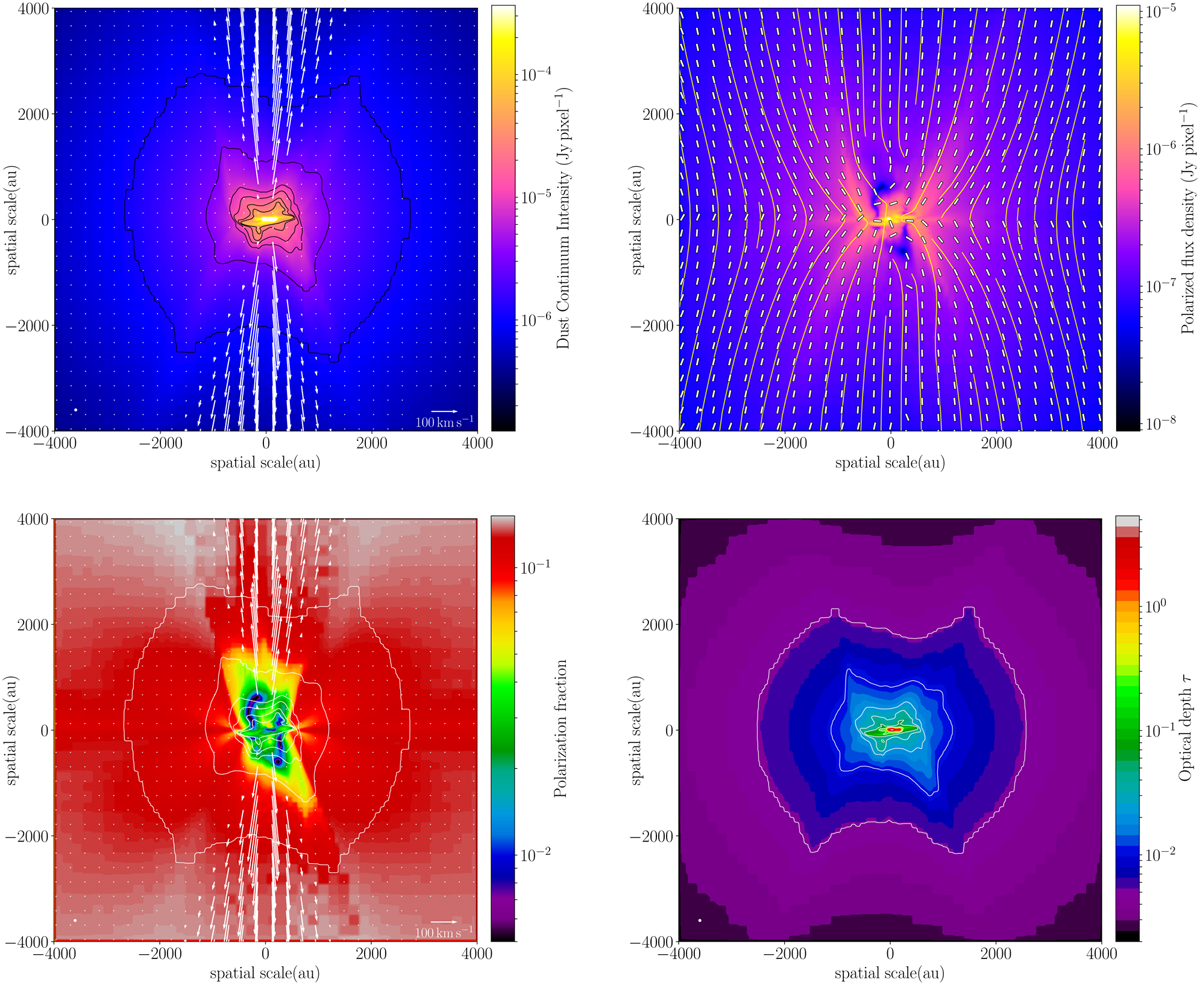
Dust polarization radiative transfer results of the fiducial case (amax = 10 µm, fhigh−j = 1, and L★ = 20 L⊙). The plots are from one run of POLARIS, where our simulation has been synthetically observed in dust polarization at 0.87 mm. Top left panel: the color scale and black contours represent the dust continuum total intensity (Stokes I). The white arrows represent the velocity field in a slice of the simulation centered on the sink particle. Top right panel: the color scale represents the polarized intensity (![]() ). The yellow streamlines trace the orientation of the density-weighted average magnetic field along the line of sight. The line segments represent the polarization position angle orientations. Bottom left panel: the color scale represents the fractional polarization, Ƥfrac. Bottom right panel: the color scale is the optical depth computed during the ray-tracing of the radiative transfer. In the bottom panels, the white contours trace the total intensity.
). The yellow streamlines trace the orientation of the density-weighted average magnetic field along the line of sight. The line segments represent the polarization position angle orientations. Bottom left panel: the color scale represents the fractional polarization, Ƥfrac. Bottom right panel: the color scale is the optical depth computed during the ray-tracing of the radiative transfer. In the bottom panels, the white contours trace the total intensity.
Current usage metrics show cumulative count of Article Views (full-text article views including HTML views, PDF and ePub downloads, according to the available data) and Abstracts Views on Vision4Press platform.
Data correspond to usage on the plateform after 2015. The current usage metrics is available 48-96 hours after online publication and is updated daily on week days.
Initial download of the metrics may take a while.