Fig. 10
Download original image
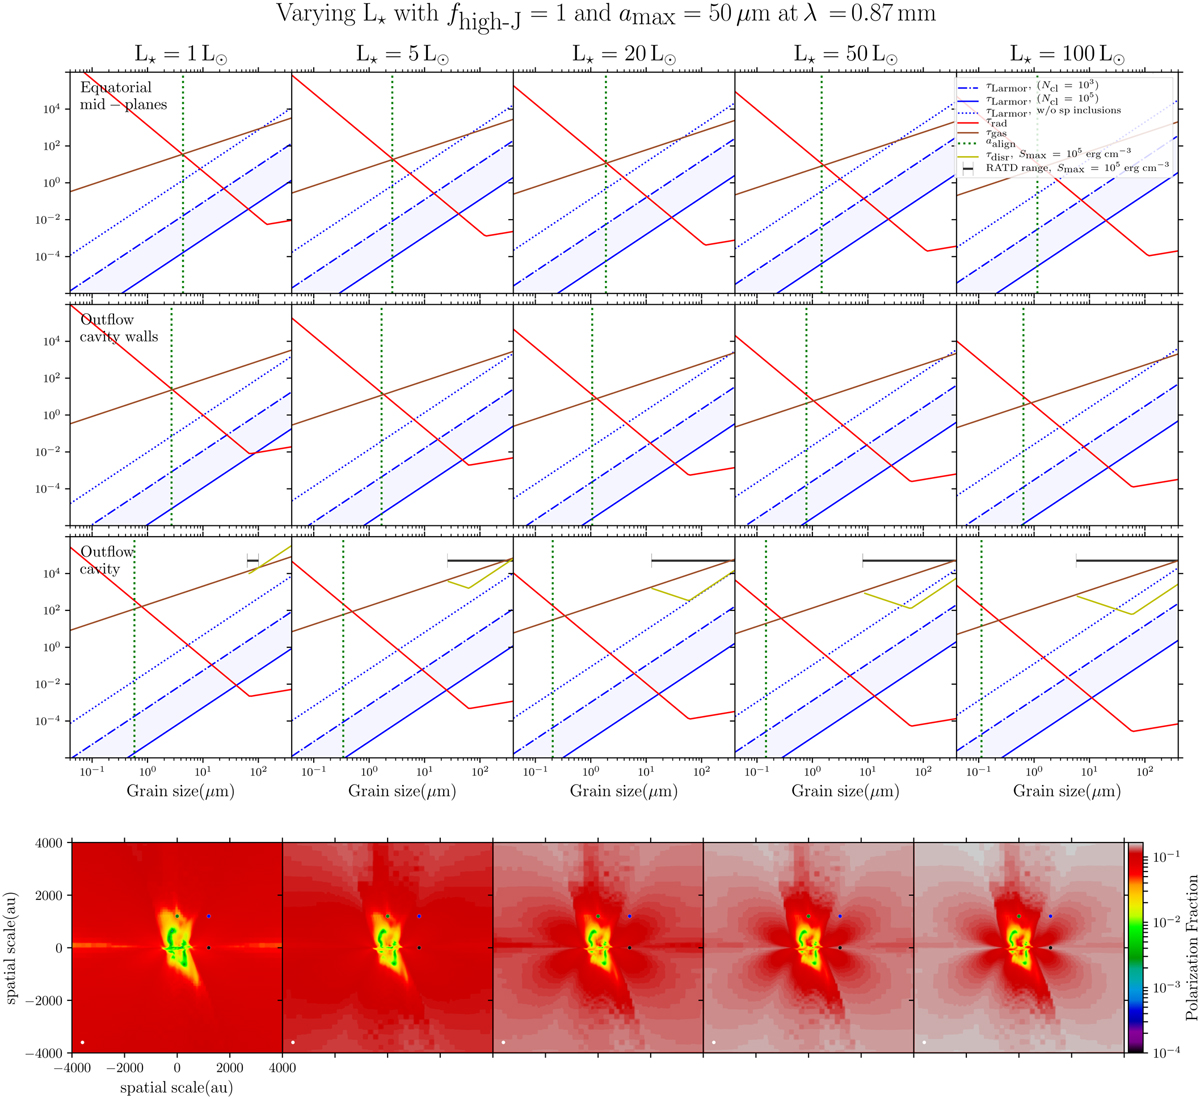
Effects of the central luminosity, L★, on the alignment timescales in our radiative transfer models at 0.87 mm, with the fixed parameters of amax = 50 µm and fhigh−J = 1. Each column is associated with a central luminosity value, L★. While the plots in the three first rows represent the alignment timescales as a function of grain size, the plots in the last row represent the polarization fraction. The timescales are computed in specific locations, i.e., toward the equatorial mid-plane (first row), at an outflow cavity wall (second row), and in the middle of an outflow cavity (third row), in the central 2D slice of the model. These locations are indicated by the three colored circles in the polarization fraction maps, with the dark point for the first row (equatorial plane), the blue point for the second row (outflow cavity wall), and the green point for the third row (outflow cavity). In each plot of the first three rows, we present the Larmor precession timescale, τLarmor (with a dotted line for a grain without super-paramagnetic inclusions and with dot-dash and solid blue lines, respectively, for two values of Ncl, the number of atoms per cluster, 103 and 105), the radiative precession timescale, τrad, the collisional gaseous damping time of the grain, τgas (solid brown line), and the rotational disruption timescale, τdisr (for an Smax value of 105 erg cm−3, in solid dark yellow lines). We show the minimum grain size of aligned grains, aalign, with the vertical dotted green line. The range of grain size affected by rotationally disruption (adisr − adisr,max) for Smax = 105 erg cm−3 is shown by the horizontal dark line. At a given grain size, the shortest precession timescale between τLarmor and τrad dictates the direction of alignment for the grains aligned at low J, i.e., with the magnetic field or the radiation field.
Current usage metrics show cumulative count of Article Views (full-text article views including HTML views, PDF and ePub downloads, according to the available data) and Abstracts Views on Vision4Press platform.
Data correspond to usage on the plateform after 2015. The current usage metrics is available 48-96 hours after online publication and is updated daily on week days.
Initial download of the metrics may take a while.