Fig. 1
Download original image
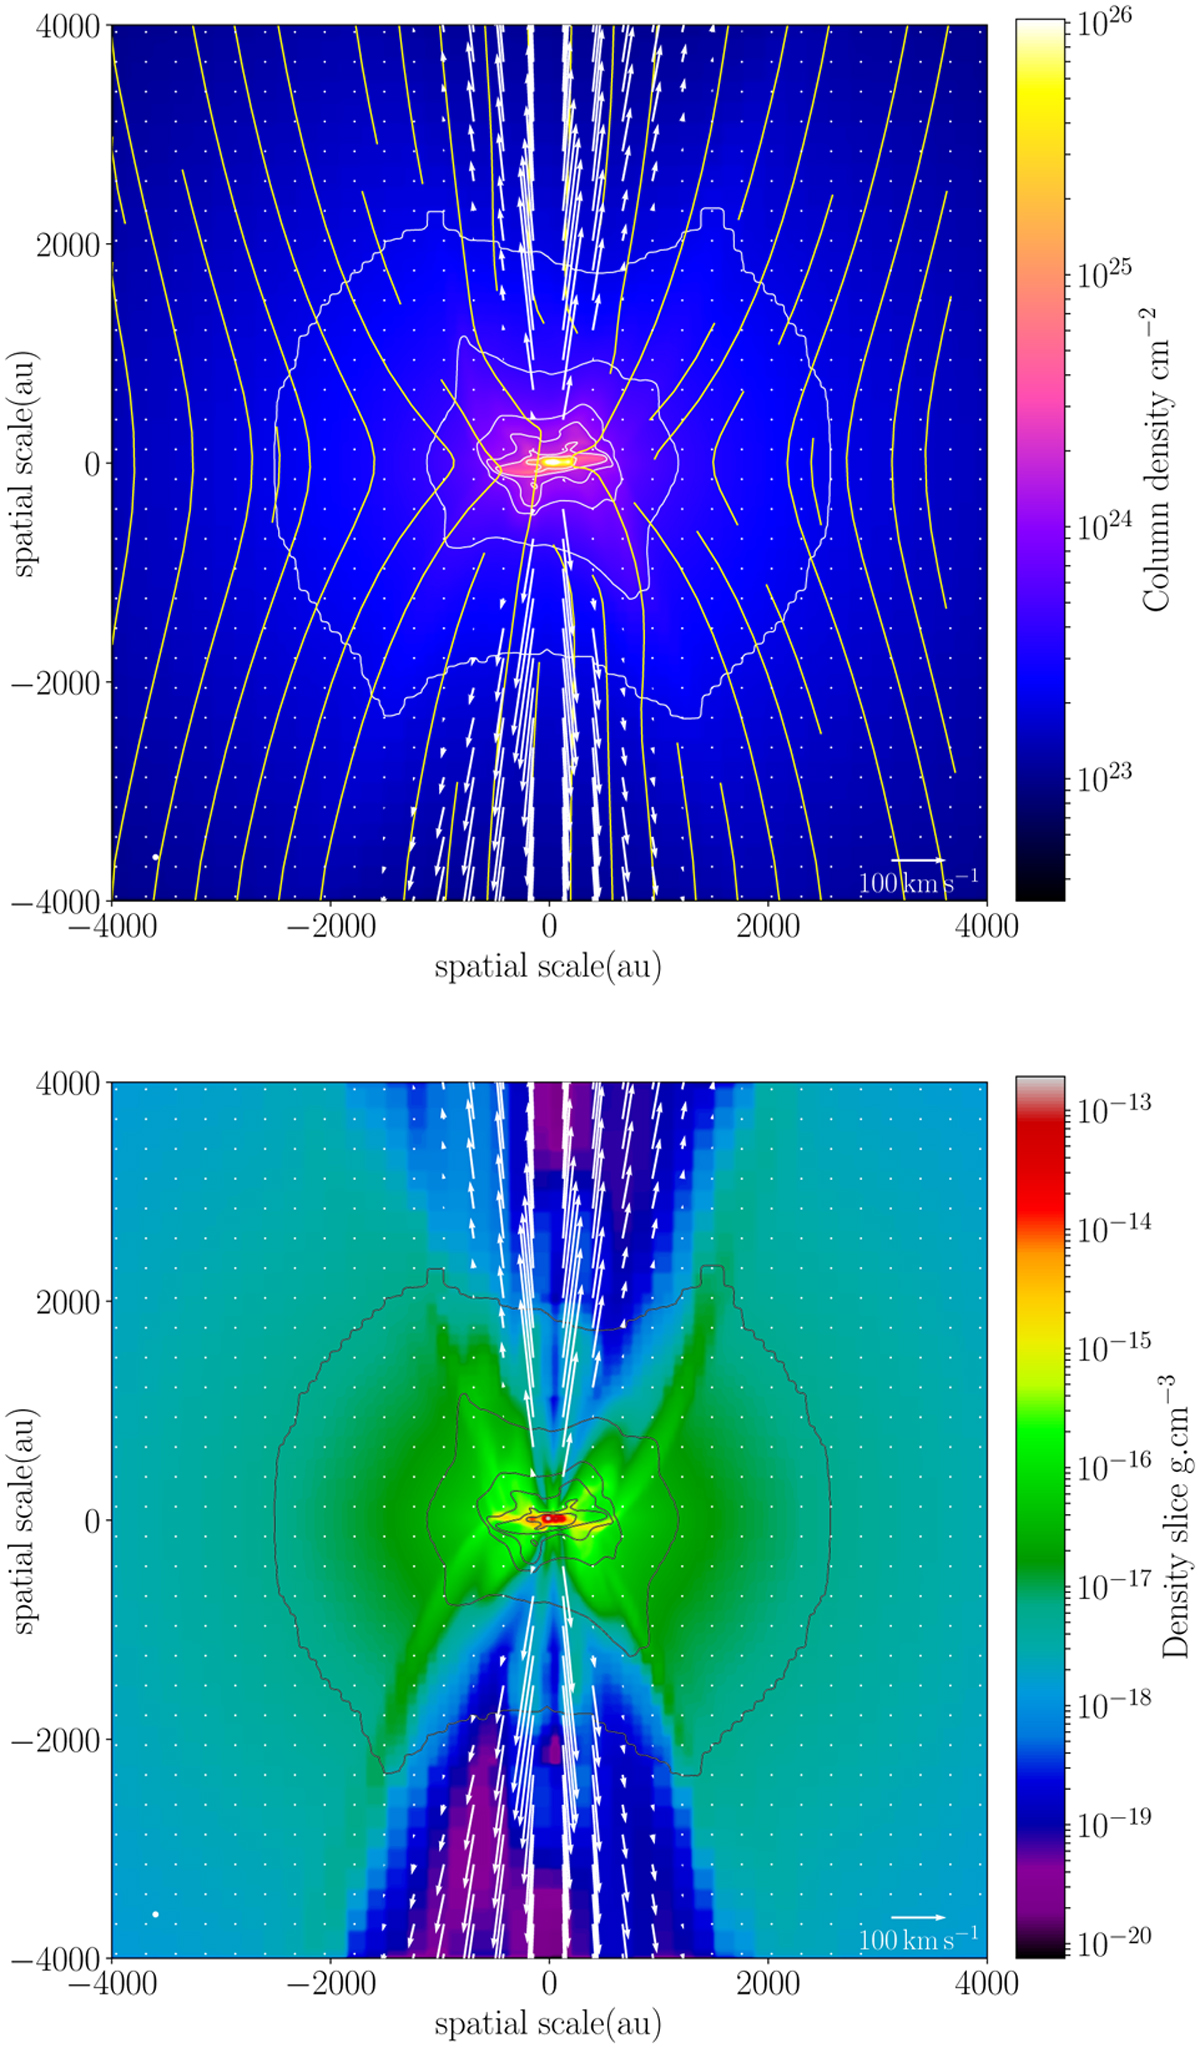
Snapshot of our MHD simulation. Top panel: system seen edge-on. The color scale and white contours represent the gas column density. The yellow streamlines trace the orientation of the density-weighted average magnetic field along the line of sight. The white arrows represent the velocity field in a slice of the simulation centered on the sink particle. Bottom panel: the contours and white arrows are the same as in the top panel. The color scale represents a slice of gas mass density, centered on the sink particle. In both panels, the little white circle is the full width half maximum of a circular Gaussian kernel we use to slightly smooth the highest resolution of the AMR grid, for visibility.
Current usage metrics show cumulative count of Article Views (full-text article views including HTML views, PDF and ePub downloads, according to the available data) and Abstracts Views on Vision4Press platform.
Data correspond to usage on the plateform after 2015. The current usage metrics is available 48-96 hours after online publication and is updated daily on week days.
Initial download of the metrics may take a while.