Open Access
Fig. 9.
Download original image
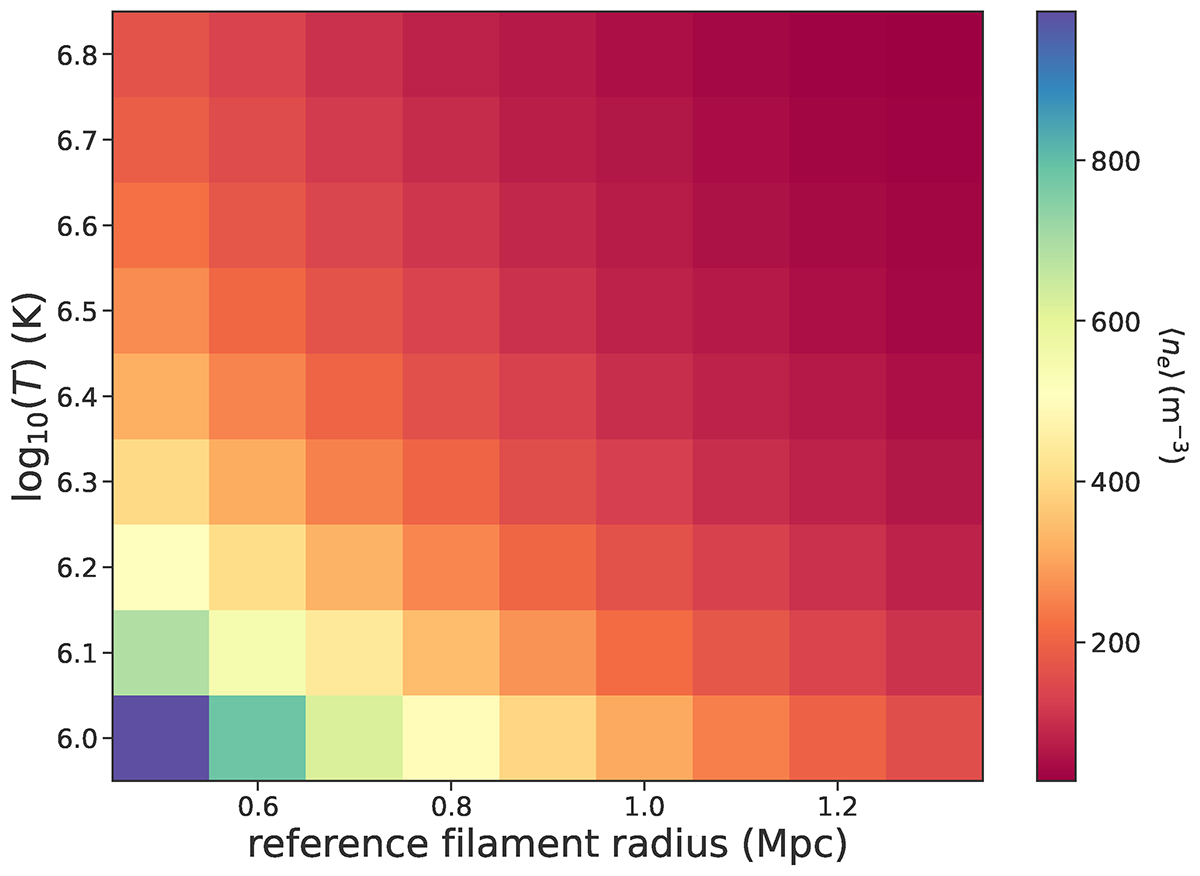
Constructed mesh grid being colored by the obtained density upper limits ⟨ne⟩ in m−3. The axes are filament temperature in logarithmic scale (isothermal assumption) versus reference (NGC 5353/4) filament radius in Mpc, which are used while modeling the filaments y-map (left panel in Fig. 2).
Current usage metrics show cumulative count of Article Views (full-text article views including HTML views, PDF and ePub downloads, according to the available data) and Abstracts Views on Vision4Press platform.
Data correspond to usage on the plateform after 2015. The current usage metrics is available 48-96 hours after online publication and is updated daily on week days.
Initial download of the metrics may take a while.