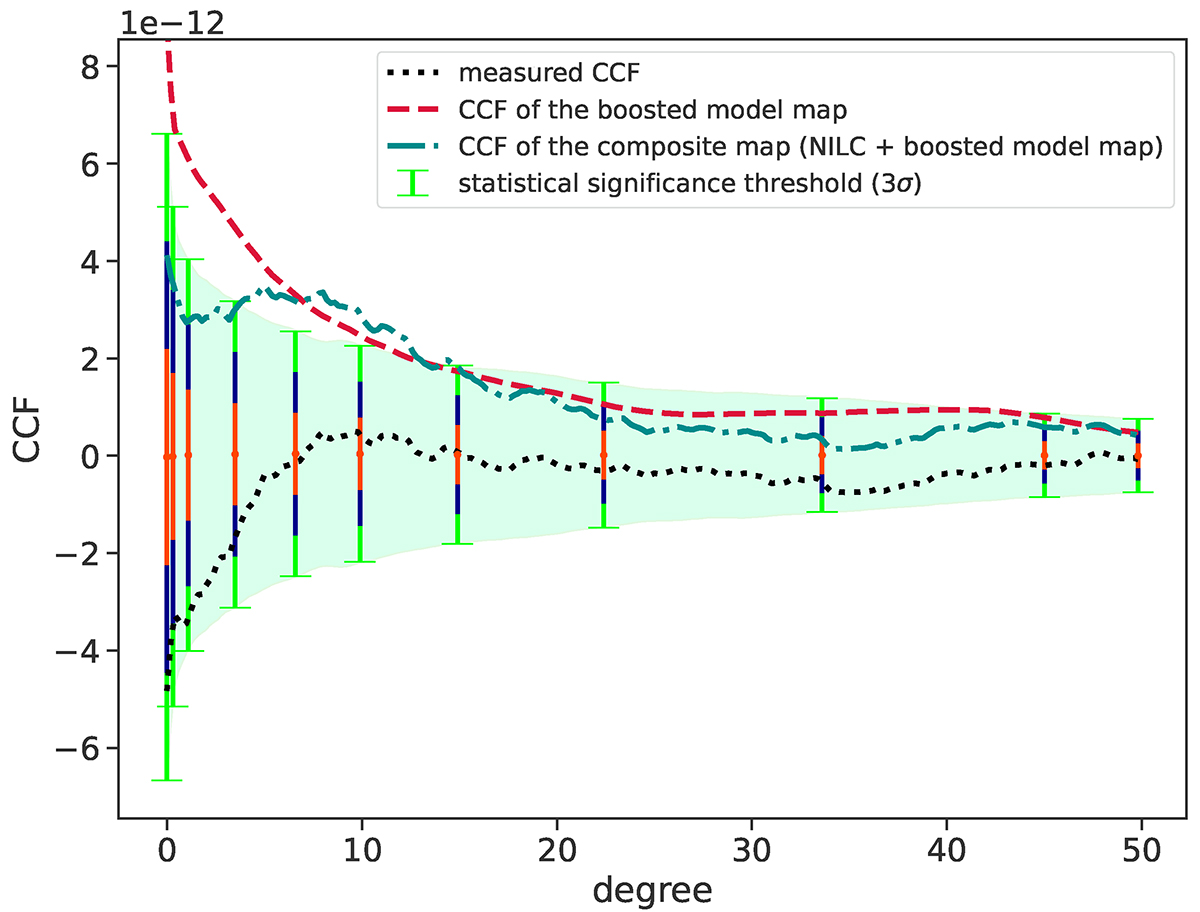
Fig. 8.
Download original image
Moment of the null hypothesis rejection, in other words, the “detection” case (Sect. 5.2), as the CCF signal of the boosted modeled filament y-map (red dashed line) exceeds the 3σ level at the positive side of the null hypothesis range (green shaded region) for a single point within the characteristic scale (gray band in Fig. 5), where the actual measured CCF signal (dotted black line) is far below this level. In fact, the measured signal appears to be totally lost as it even could not exceed the 1σ range (1,2, and 3σ intervals for the null hypothesis are shown with different colored bars: orange, blue, and green, respectively). The turquoise dash-dotted line corresponds to the CCF signal being extracted from the composite map as a summation of the masked NILC y-map and boosted modeled filament y-map.
Current usage metrics show cumulative count of Article Views (full-text article views including HTML views, PDF and ePub downloads, according to the available data) and Abstracts Views on Vision4Press platform.
Data correspond to usage on the plateform after 2015. The current usage metrics is available 48-96 hours after online publication and is updated daily on week days.
Initial download of the metrics may take a while.