Fig. 7.
Download original image
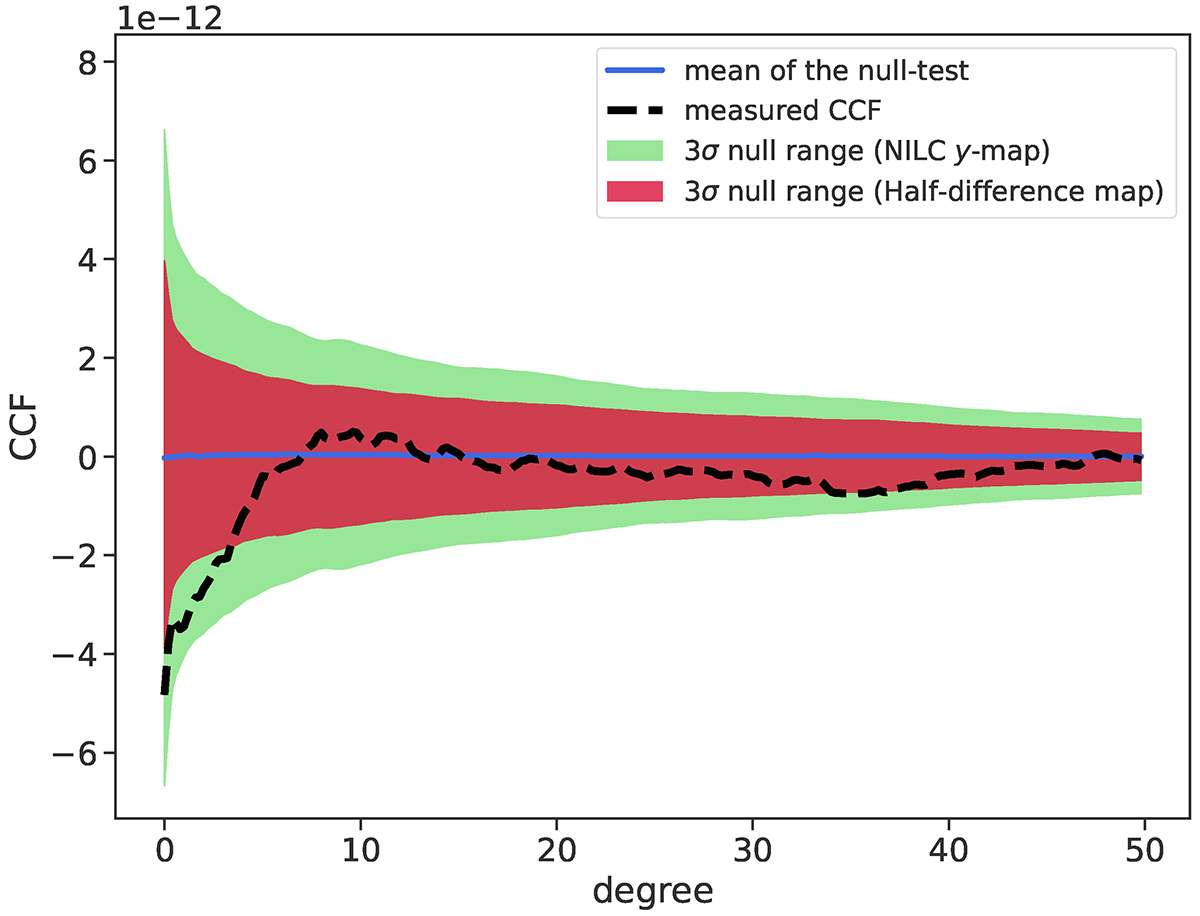
Measured cross-correlation function between masked NILC y-map and constructed galaxy density map is shown with a black dashed line, as a potential indicator of the existence of WHIM in the filamentary structures around the Virgo Cluster. Green and red colored regions correspond to the 3σ range around the mean value (the blue line) being extracted from null tests by using masked NILC y-map and half-difference map, respectively. In other words, these shaded regions correspond to our benchmark to check the significance of the measured signal. It is obvious that the measured signal cannot reject the null hypothesis (one-tailed hypothesis test for the expected positive correlation), even when the statistic of the half-difference map is exploited, as the signal does not exceed the positive side of the 3σ range in the benchmark.
Current usage metrics show cumulative count of Article Views (full-text article views including HTML views, PDF and ePub downloads, according to the available data) and Abstracts Views on Vision4Press platform.
Data correspond to usage on the plateform after 2015. The current usage metrics is available 48-96 hours after online publication and is updated daily on week days.
Initial download of the metrics may take a while.