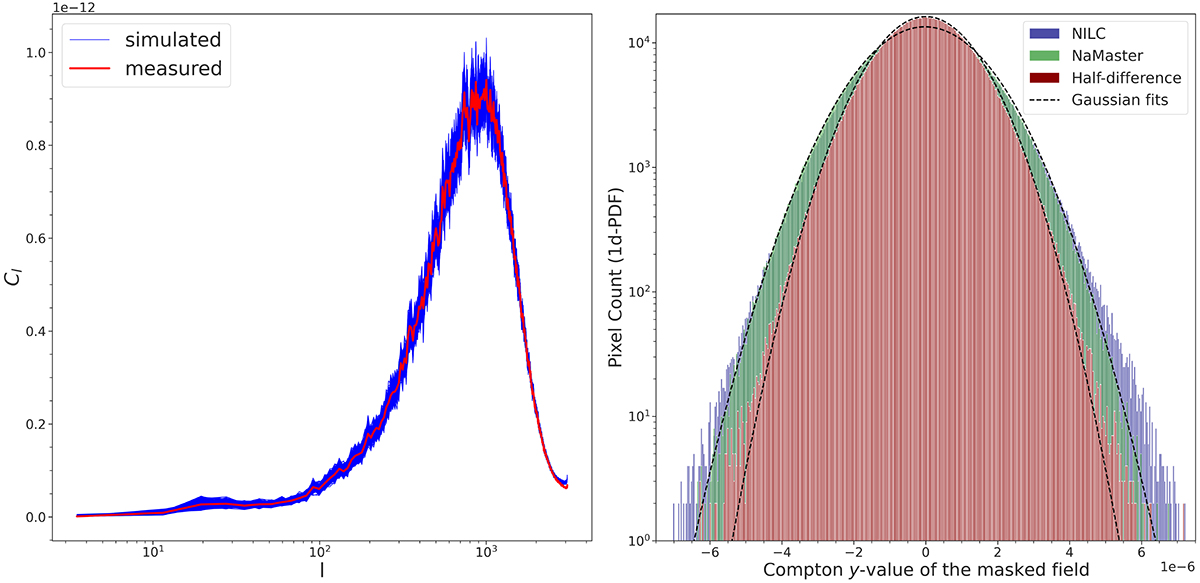
Fig. 6.
Download original image
Power spectrum comparison between randomly created maps via Algorithm 2 (blue lines) and actual NILC y-map (red line), including the cumulative mask (Sect. 3.2), shown on the left. 1D probability density functions (PDF) of the unmasked pixel values for the NILC y-map (blue bars), one of the simulated maps (with NaMaster) by using the analyzed NILC y-map field itself (green bars), and one of the simulated maps by using the half-difference map (red bars), shown on the right. Gaussian fits are sketched for the histograms of randomly simulated maps (black dashed lines). Excess of the signal seen in the NILC y-map (blue bars at the leftmost and rightmost parts of the histogram) compared to the random simulation (green bars) in the right panel indicates some measure of non-Gaussianity originated from ∼1/10 000 of the total map pixel number, and therefore limits the statistical representability of the underlying field (NILC y-map, at this case) via random realizations obtained from a cross-correlation method (Sect. 3.1). Together with the left panel, it’s obvious that usage of the half-difference map is not suitable for the null tests as it’s not providing the matching statistics. On the other hand, by taking advantage of NaMaster to create simulated maps which are obtained by using the own statistics of the analyzed field (right panel in Fig. 3) appears to be the best option with respect to conducting null tests in our case. This is because it mimics the reference field also statistically by reaching a good agreement with the signal characteristics, which can be directly seen from both 1D PDF and power spectrum comparisons.
Current usage metrics show cumulative count of Article Views (full-text article views including HTML views, PDF and ePub downloads, according to the available data) and Abstracts Views on Vision4Press platform.
Data correspond to usage on the plateform after 2015. The current usage metrics is available 48-96 hours after online publication and is updated daily on week days.
Initial download of the metrics may take a while.