Fig. 5.
Download original image
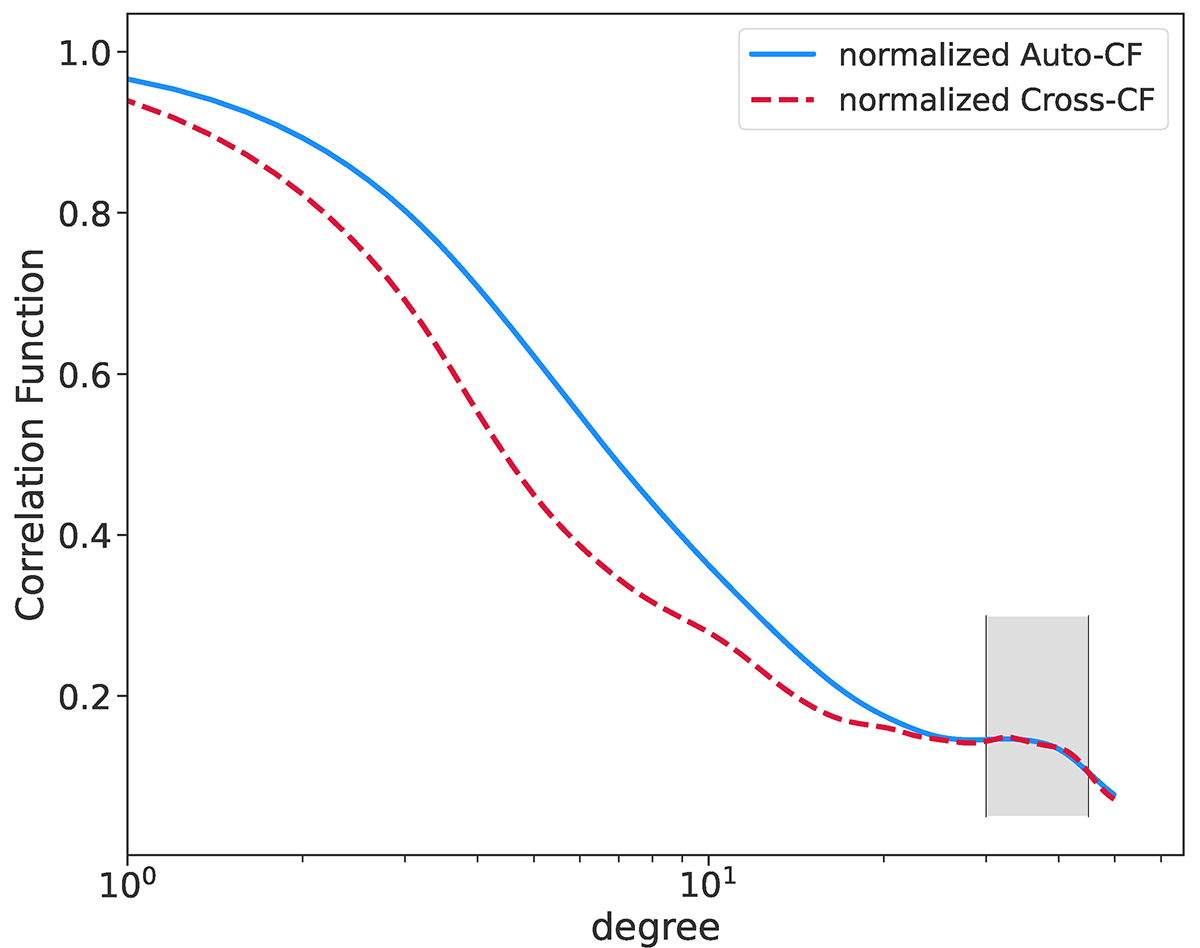
Expected normalized correlation functions for the masked version (Sect. 3.2) of the noise-free (and also without any contamination) fields that are shown in Fig. 2. The blue line points up the auto-correlation function for the modeled filament y-map (left panel in Fig. 2). Red dashed line shows the cross-correlation function between filament y-map and galaxy density map (right panel in Fig. 2). The characteristic statistical feature of these filamentary structures in terms of correlation degree is obviously seen as a bump in large scales roughly between 30 and 40 degrees, which is shown with a gray band. This scale corresponds to the average separation between primary elongation occurrences of the filamentary structures, as the bump in correlation function indicates that there should be a specific repetitive interval within the analyzed topology.
Current usage metrics show cumulative count of Article Views (full-text article views including HTML views, PDF and ePub downloads, according to the available data) and Abstracts Views on Vision4Press platform.
Data correspond to usage on the plateform after 2015. The current usage metrics is available 48-96 hours after online publication and is updated daily on week days.
Initial download of the metrics may take a while.