Fig. 9
Download original image
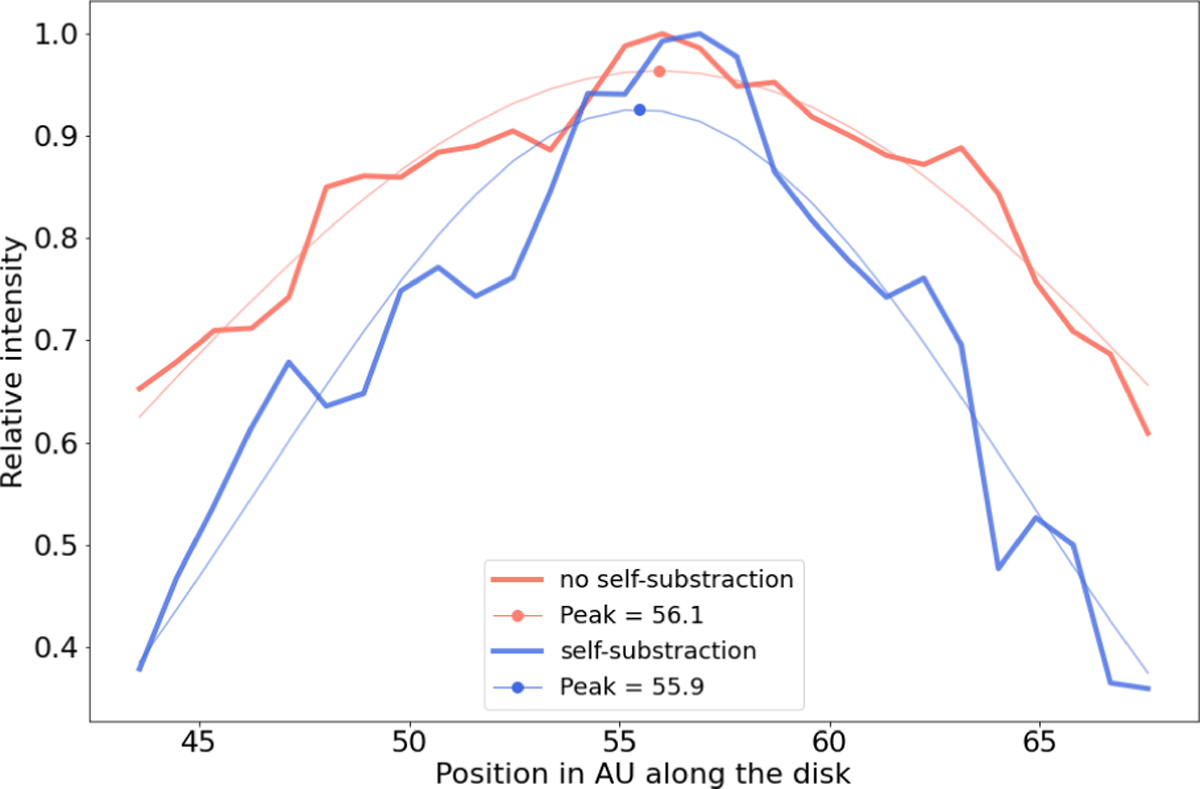
Comparison of methods for measuring the position of C1 in the 2019 data. Red curve corresponds to the relative intensity from the PCA image, while the blue curve corresponds to the centro-symmetrical self-subtraction of the disk, from the same PCA image. Both methods provide the same result ±0.2 au. The position was measured by doing a Gaussian fit on the peak. The two curves have been normalized to make the comparison more visible.
Current usage metrics show cumulative count of Article Views (full-text article views including HTML views, PDF and ePub downloads, according to the available data) and Abstracts Views on Vision4Press platform.
Data correspond to usage on the plateform after 2015. The current usage metrics is available 48-96 hours after online publication and is updated daily on week days.
Initial download of the metrics may take a while.