Open Access
Fig. 2
Download original image
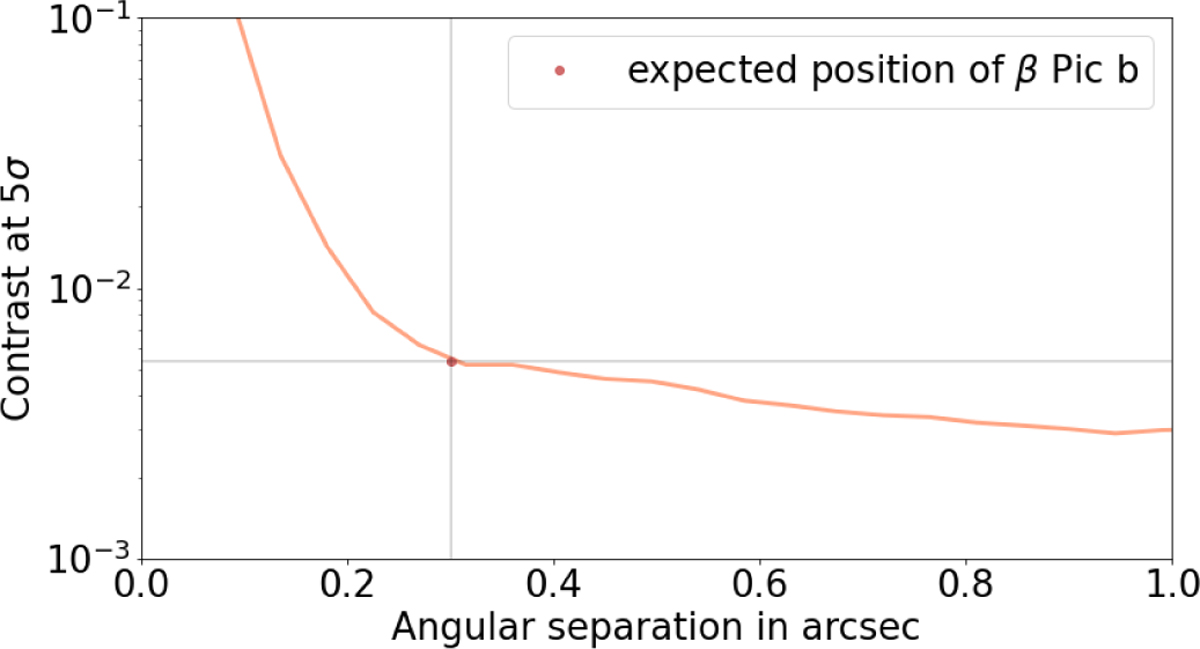
Contrast curve at 5σ as measured along the disk spine across a width of 1″, as measured on the PCA image. The contrast of β Pic b with respect to the star and its distance to the star is indicated by the grey lines.
Current usage metrics show cumulative count of Article Views (full-text article views including HTML views, PDF and ePub downloads, according to the available data) and Abstracts Views on Vision4Press platform.
Data correspond to usage on the plateform after 2015. The current usage metrics is available 48-96 hours after online publication and is updated daily on week days.
Initial download of the metrics may take a while.