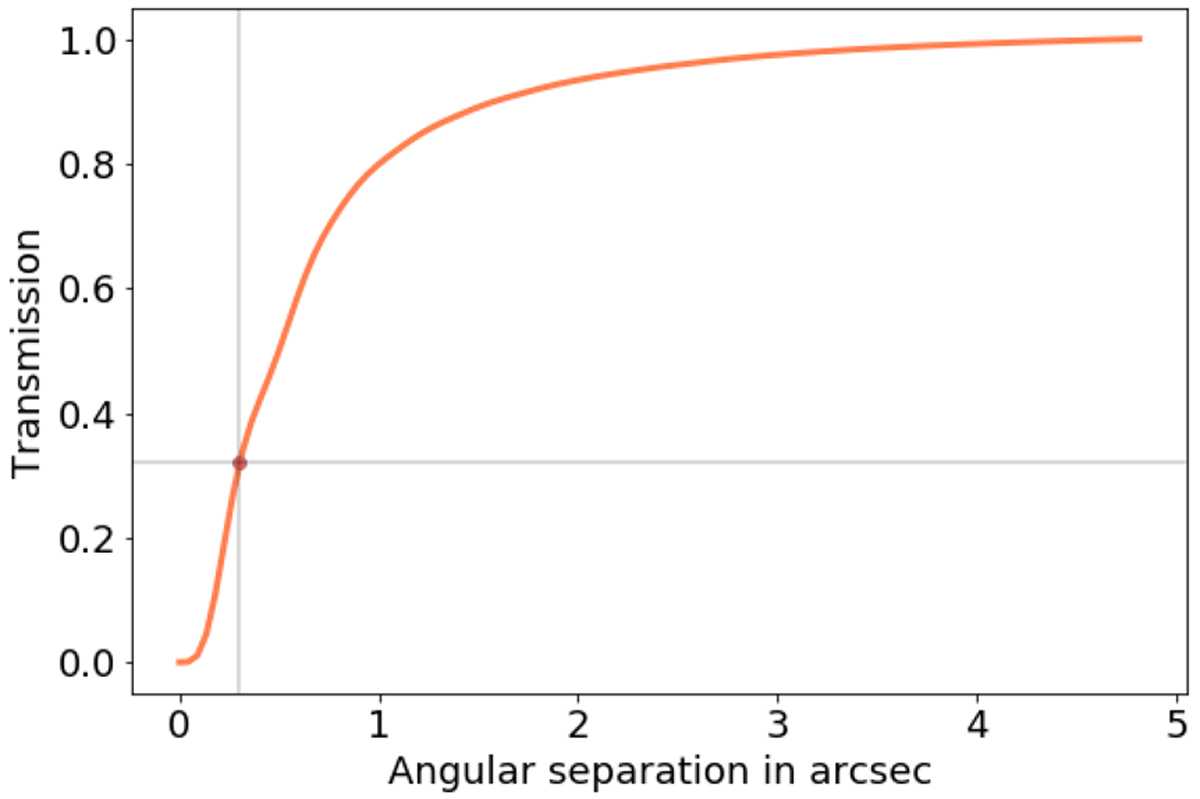
Fig. A.1
Download original image
Transmission of the AGPM coronagraph as a function of the separation, simulated by scanning a point source radially with respect to the center of the coronagraph. The transmission is measured in the central pixel of the point source image and normalized to the unattenuated PSF. The transmission at the expected position of the planet β Pic b, at 0.3”, is 32%, identified as a brown dot in the plot.
Current usage metrics show cumulative count of Article Views (full-text article views including HTML views, PDF and ePub downloads, according to the available data) and Abstracts Views on Vision4Press platform.
Data correspond to usage on the plateform after 2015. The current usage metrics is available 48-96 hours after online publication and is updated daily on week days.
Initial download of the metrics may take a while.