Open Access
Fig. 14
Download original image
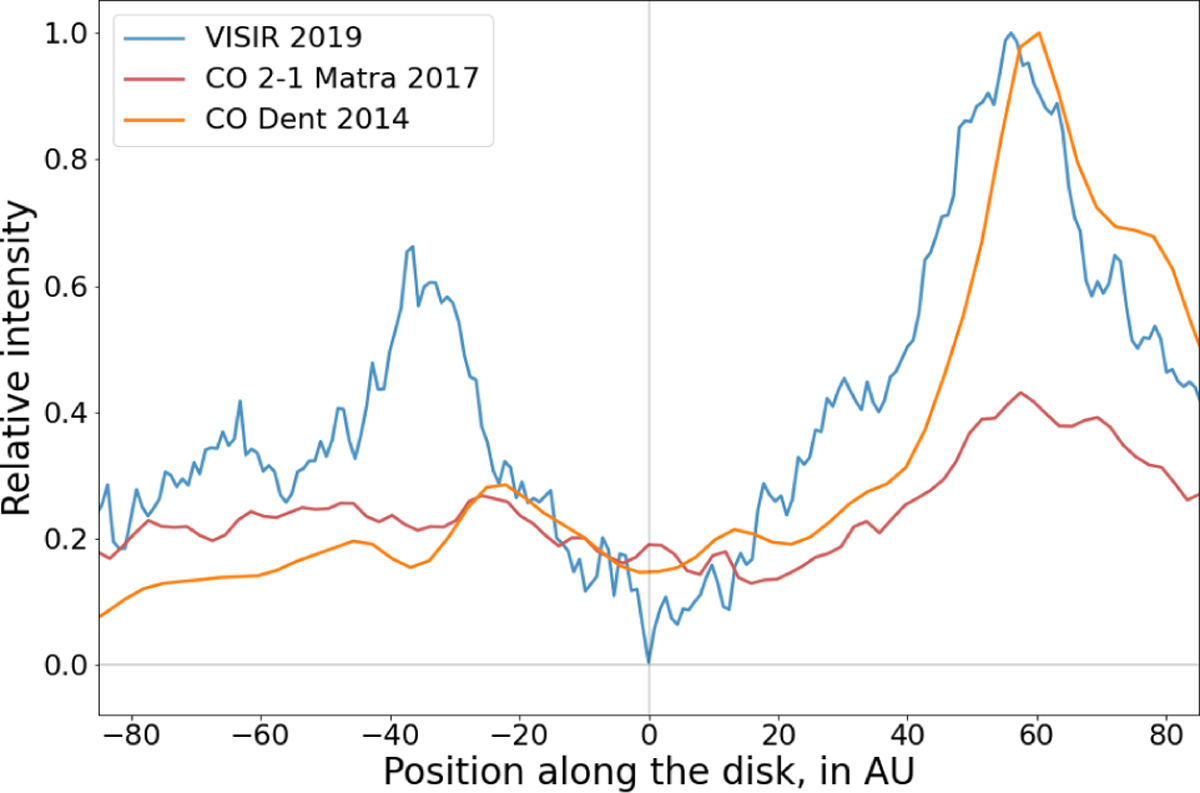
Projected distribution of CO lines flux obtained from Dent et al. (2014) and Matrà et al. (2017), superimposed with the radial flux distribution of the disk at 12µm with VISIR. The VISIR and CO 3–2 (Dent et al. 2014) curves have beennormalized bytheirmaximum.
Current usage metrics show cumulative count of Article Views (full-text article views including HTML views, PDF and ePub downloads, according to the available data) and Abstracts Views on Vision4Press platform.
Data correspond to usage on the plateform after 2015. The current usage metrics is available 48-96 hours after online publication and is updated daily on week days.
Initial download of the metrics may take a while.