Fig. 14.
Download original image
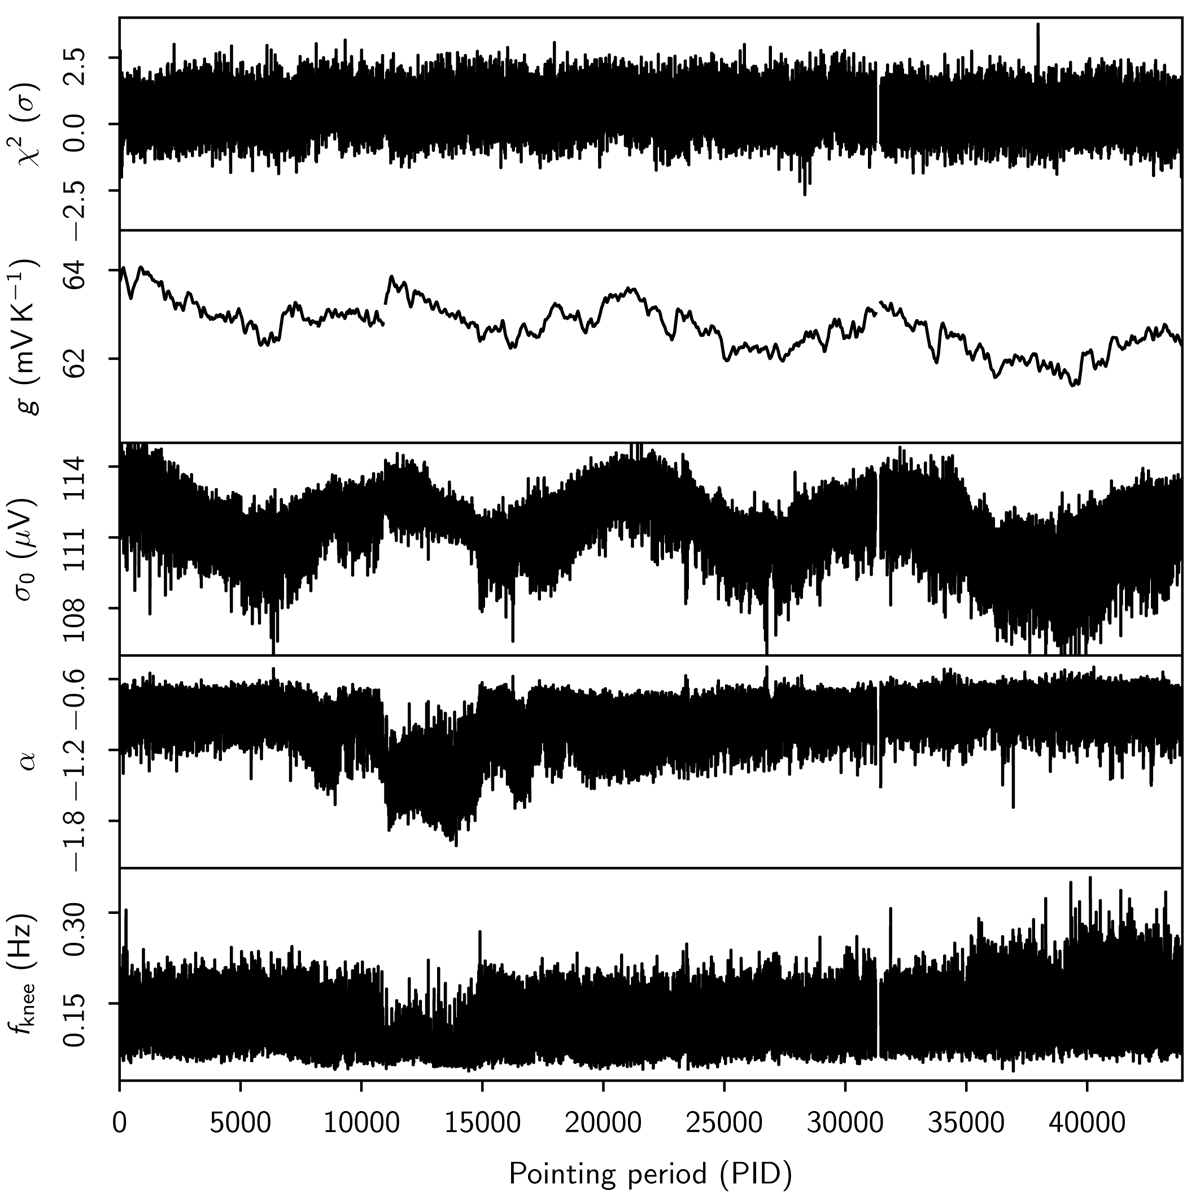
Single Gibbs sample for the 30 GHz LFI 28M radiometer as a function of PID. From top to bottom the panels show (1) normalized reduced χ2; (2) gain, g; (3) white noise level, σ0; (4) correlated noise slope, α; and (5) correlated noise knee frequency, fknee.
Current usage metrics show cumulative count of Article Views (full-text article views including HTML views, PDF and ePub downloads, according to the available data) and Abstracts Views on Vision4Press platform.
Data correspond to usage on the plateform after 2015. The current usage metrics is available 48-96 hours after online publication and is updated daily on week days.
Initial download of the metrics may take a while.