Fig. 9
Download original image
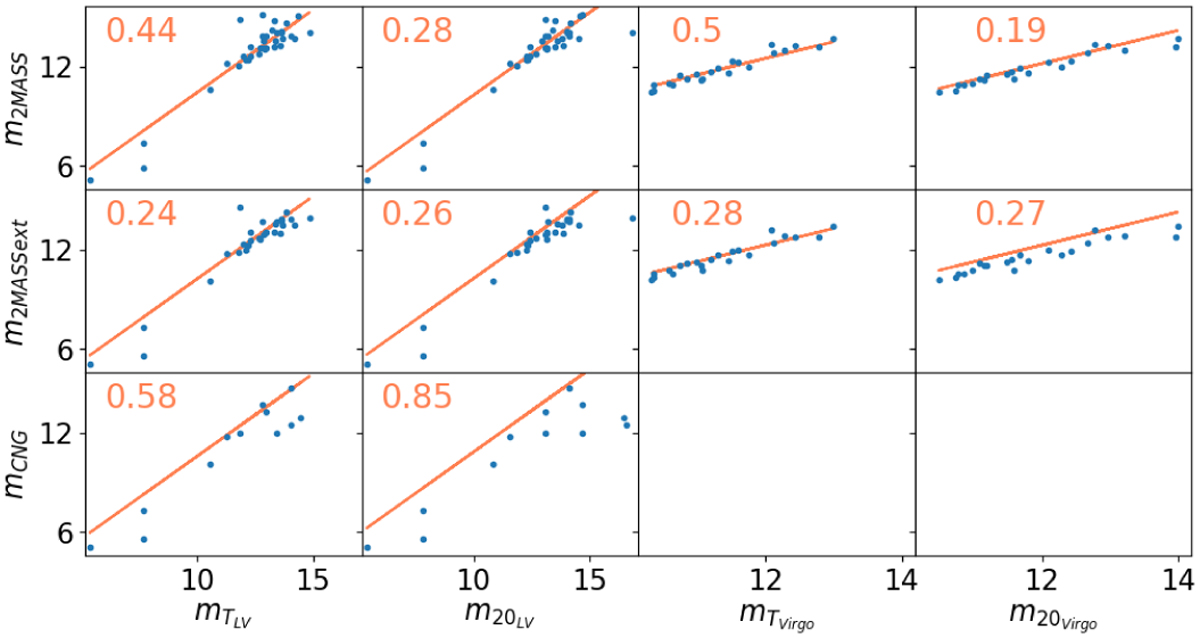
Comparison of our calculated magnitudes (X axis) with published catalog data (Y axis). The orange upper-left number in each subplot represents the median deviation between the respective catalog and our measured values. The orange line marks the ideal linear correlation, this function having a slope of one and intercept equal to the median deviation value.
Current usage metrics show cumulative count of Article Views (full-text article views including HTML views, PDF and ePub downloads, according to the available data) and Abstracts Views on Vision4Press platform.
Data correspond to usage on the plateform after 2015. The current usage metrics is available 48-96 hours after online publication and is updated daily on week days.
Initial download of the metrics may take a while.