Fig. 7
Download original image
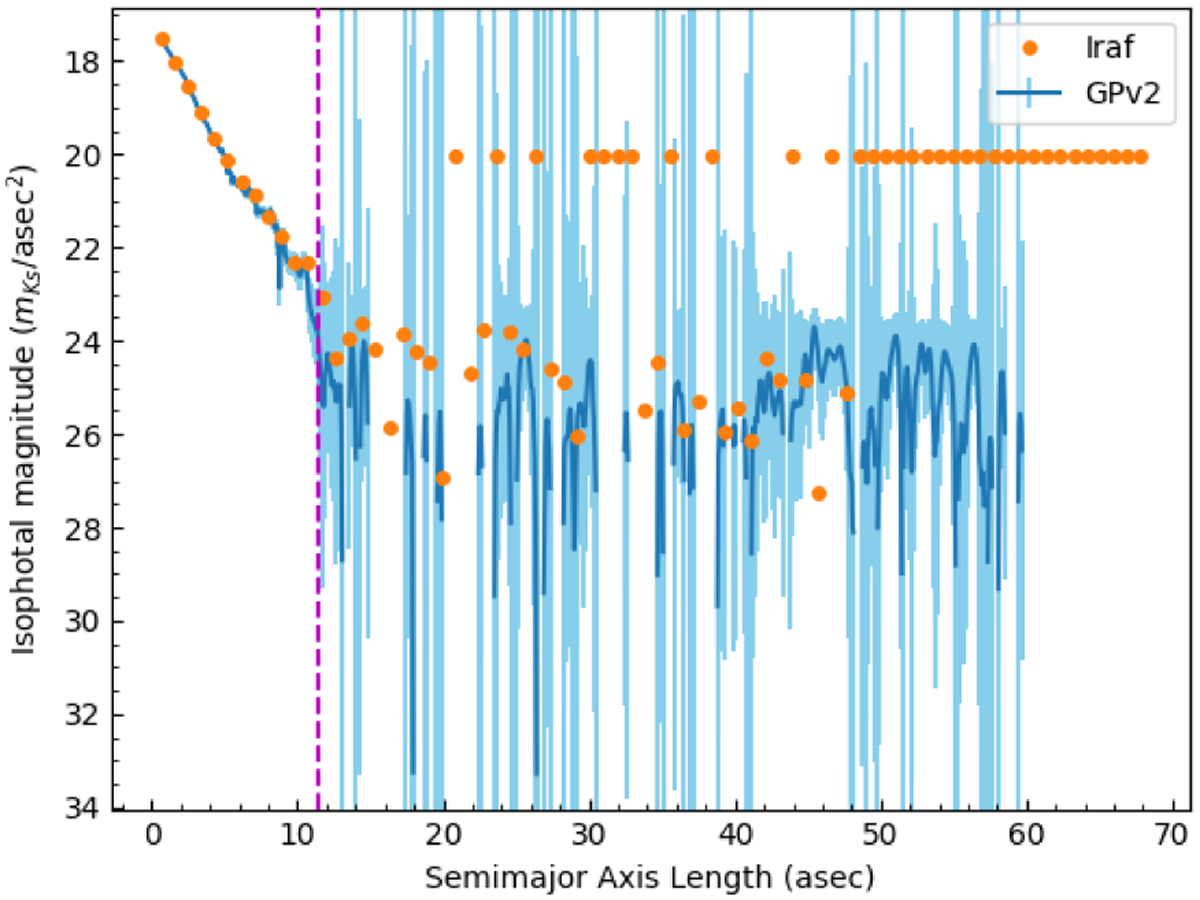
IRAF versus GPv2 comparison for galaxy LEDA 126848. The dark-blue line is the GPv2 results, the orange dots are the IRAF result, and the vertical dashed magenta line marks the adopted size of the galaxy (aT). The light-blue vertical lines represent the error bars in the GPv2 model. For the IRAF results, the failed calculation points have the zero point value, while in Python those values are “NaN” and do not appear in the plot.
Current usage metrics show cumulative count of Article Views (full-text article views including HTML views, PDF and ePub downloads, according to the available data) and Abstracts Views on Vision4Press platform.
Data correspond to usage on the plateform after 2015. The current usage metrics is available 48-96 hours after online publication and is updated daily on week days.
Initial download of the metrics may take a while.