Fig. 3
Download original image
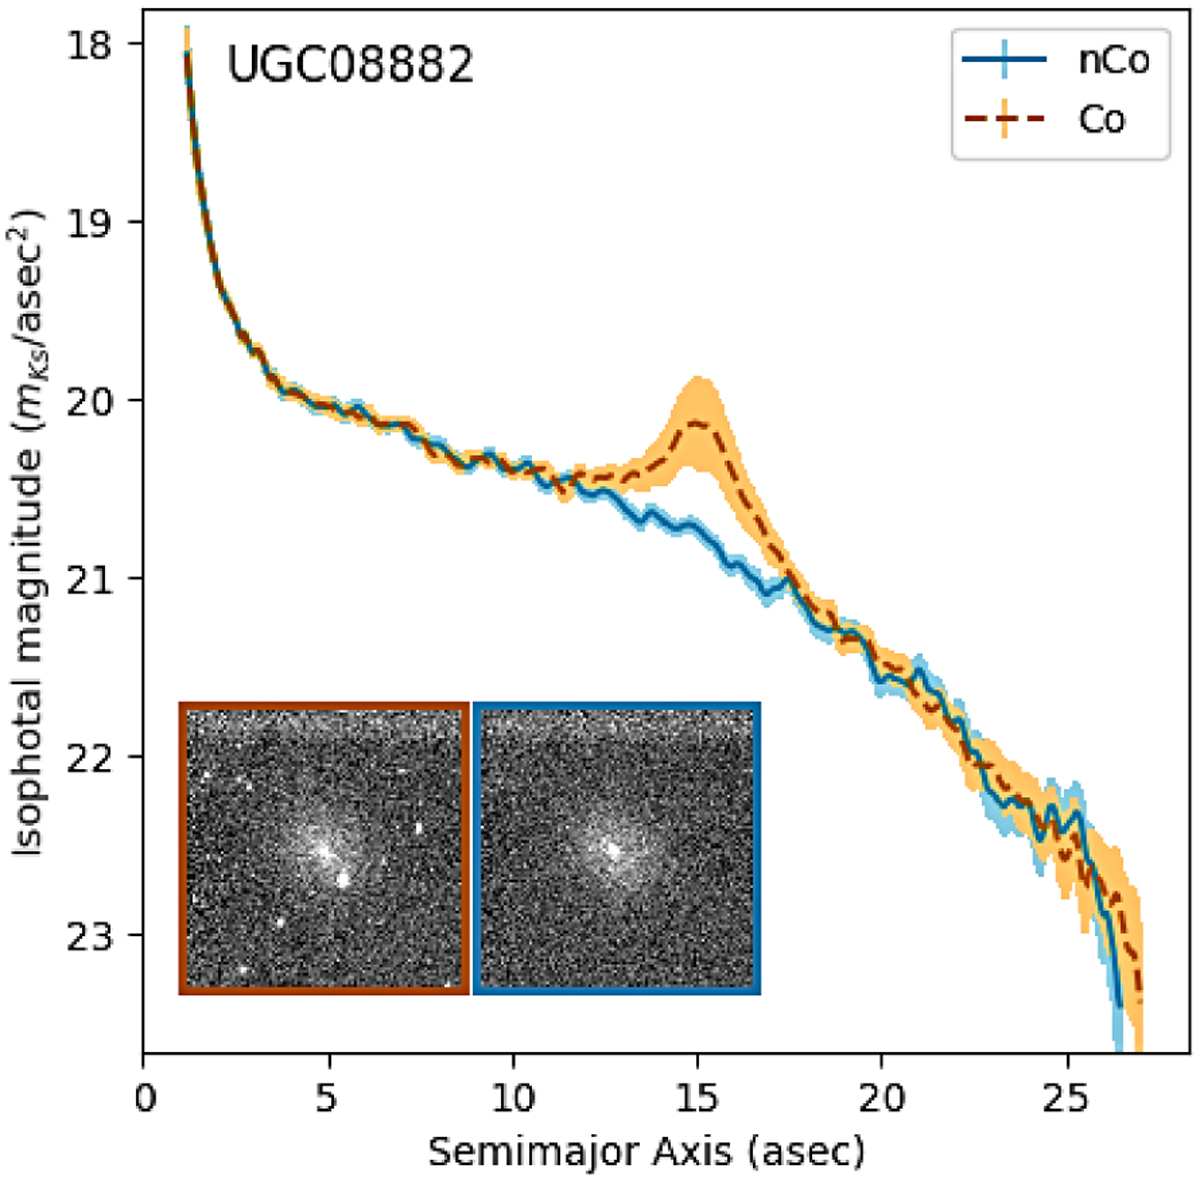
Example of the effect of a nearby object in the isophotal analysis of UGC 8882. The blue continuous line shows the result of the SBP modeling for the case when masking was used before data reduction, so that no close objects were present (nCo); see the right insert image. The dashed green line shows the results of SBP modeling without removing the close objects (Co), where all the surrounding objects are contributing; see the left insert image.
Current usage metrics show cumulative count of Article Views (full-text article views including HTML views, PDF and ePub downloads, according to the available data) and Abstracts Views on Vision4Press platform.
Data correspond to usage on the plateform after 2015. The current usage metrics is available 48-96 hours after online publication and is updated daily on week days.
Initial download of the metrics may take a while.