Fig. 14

Download original image
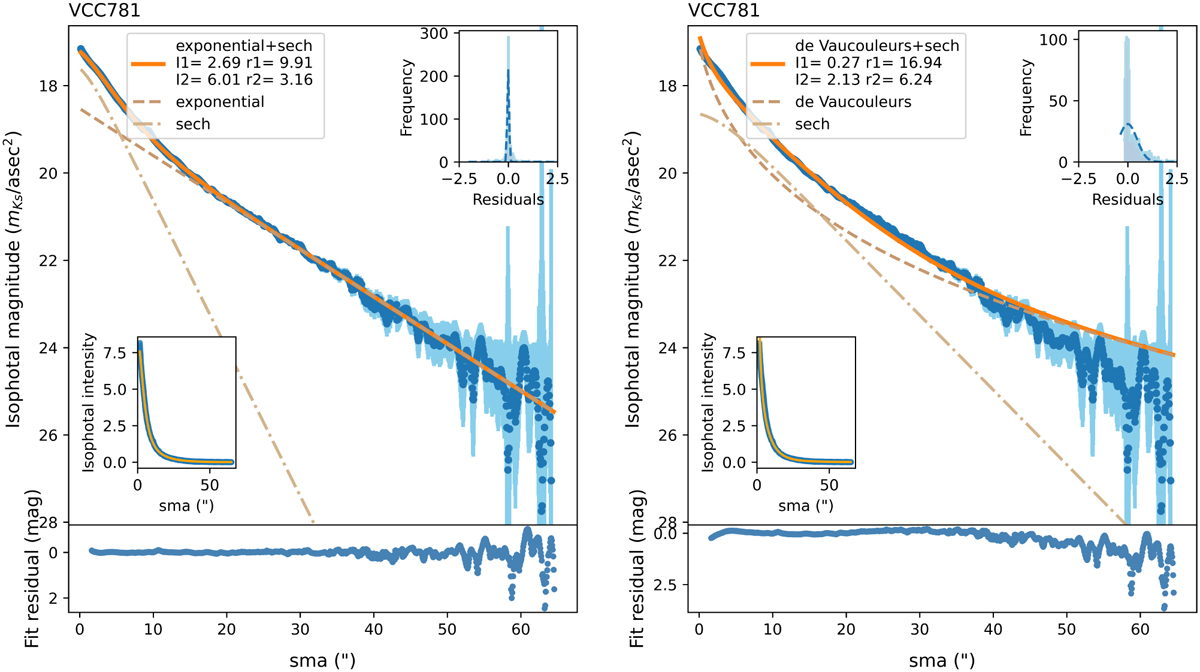
Example for the sech component (dash-dotted) contribution for fitting dEs, VCC 781 (main, big plots).The left plot shows the fit of the exponential plus sech functions, which overlay perfectly over the measured profile. The right plot shows the fit of the de Vaucouleurs plus sech functions, which follows the outer region of the galaxy within the errors but fails at the galaxy center. The fitting was done for isophotal intensities, see lower left inserts, however for better examination of the fit we convert the fitting function into magnitudes. The bottom plot shows the residuals for the model subtracted from the data. The upper right inserts show the distribution of the residuals fitted with normal distribution probability density function.
Current usage metrics show cumulative count of Article Views (full-text article views including HTML views, PDF and ePub downloads, according to the available data) and Abstracts Views on Vision4Press platform.
Data correspond to usage on the plateform after 2015. The current usage metrics is available 48-96 hours after online publication and is updated daily on week days.
Initial download of the metrics may take a while.


