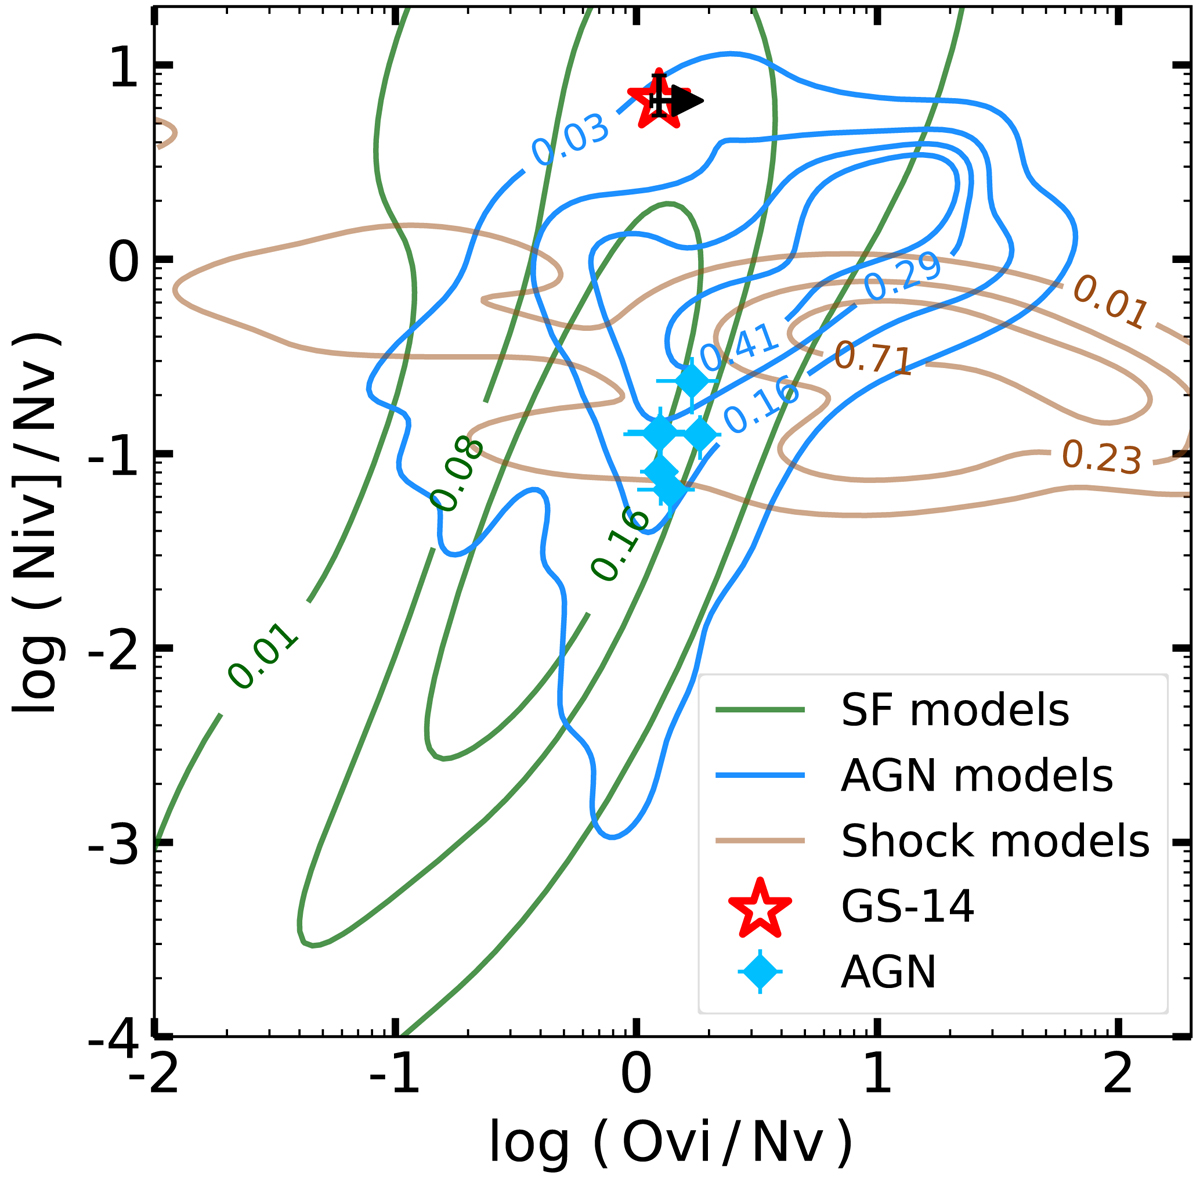
Fig. 3.
Download original image
Comparison of GS-14 (red star), literature AGN (cyan diamonds), and nebular theoretical predictions of the N IV]/N V and O VI/N V flux ratios. The contours represent isoproportions of the density (i.e., 8% of the probability mass lies outside of the contour drawn for 0.08). Brown contours refer to shock predictions from the Morisset et al. (2015) 3MDBS database, green contours to SF models from Gutkin et al. (2016), and blue contours to AGN emission as computed by Feltre et al. (2016). Literature AGN are the sources described in Sect. 2.3 and in Appendix A with all the three lines detected. No shock model is able to reproduce the GS-14 line ratios; SF and AGN can both be at the origin of the observed nebular emission. As the GS-14 O VI line is not corrected for the IGM attenuation, we have only a lower limit on its flux, thus a lower limit on the O VI/N V ratio (black arrow).
Current usage metrics show cumulative count of Article Views (full-text article views including HTML views, PDF and ePub downloads, according to the available data) and Abstracts Views on Vision4Press platform.
Data correspond to usage on the plateform after 2015. The current usage metrics is available 48-96 hours after online publication and is updated daily on week days.
Initial download of the metrics may take a while.