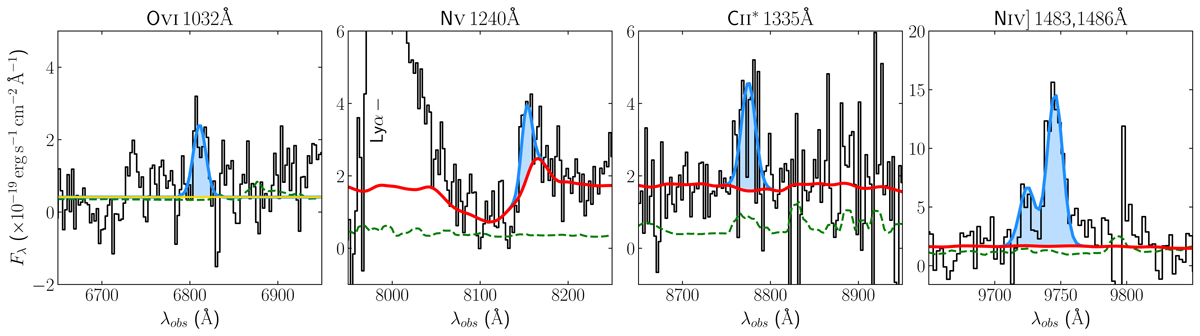
Fig. 2.
Download original image
Spectra and best-fit models for the GS-14 main spectral features analyzed in this work. From left to right: O VI1032 Å, N V1240 Å, C II* 1335 Å, and N IV] 1483,1486 Å. The red line is the SS99 best-fit model, the Gaussian best fit for the emission feature is plotted in blue, the yellow line represents the continuum in the Lyman forest region, and the green line shows the spectrum noise. In the second panel, the strong emission line at λobs ∼ 8000 Å is the Lyα line. For the complete VIMOS spectrum, see Fig. 2 in Grazian et al. (2020).
Current usage metrics show cumulative count of Article Views (full-text article views including HTML views, PDF and ePub downloads, according to the available data) and Abstracts Views on Vision4Press platform.
Data correspond to usage on the plateform after 2015. The current usage metrics is available 48-96 hours after online publication and is updated daily on week days.
Initial download of the metrics may take a while.