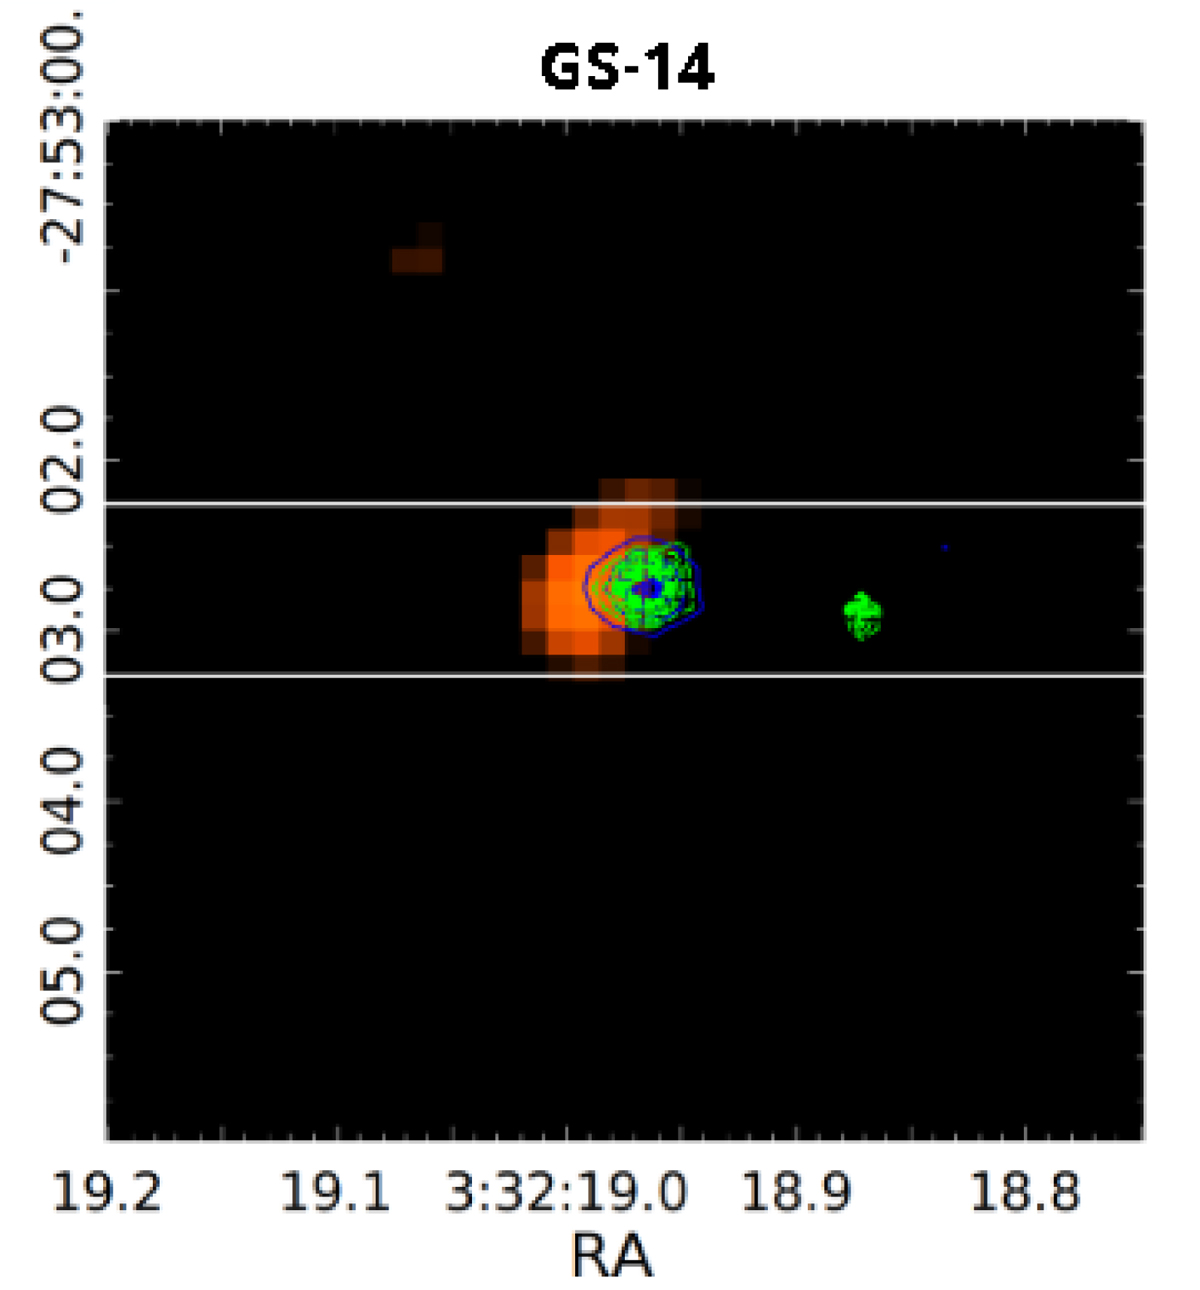
Fig. 1.
Download original image
GS-14 [C II] 158 μm flux map. The green contours represent the emission in the r+ SUBARU filter in which the Lyα line falls, and the blue contours show the emission in the ULTRAVISTA Ks filter (Cassata et al. 2020). The source is not resolved in any of the three wavelength ranges. Vanzella et al. (2010) associated an effective radius to the Ks emission of re[3300 Å] < 0.9 kpc.
Current usage metrics show cumulative count of Article Views (full-text article views including HTML views, PDF and ePub downloads, according to the available data) and Abstracts Views on Vision4Press platform.
Data correspond to usage on the plateform after 2015. The current usage metrics is available 48-96 hours after online publication and is updated daily on week days.
Initial download of the metrics may take a while.