Fig. 8.
Download original image
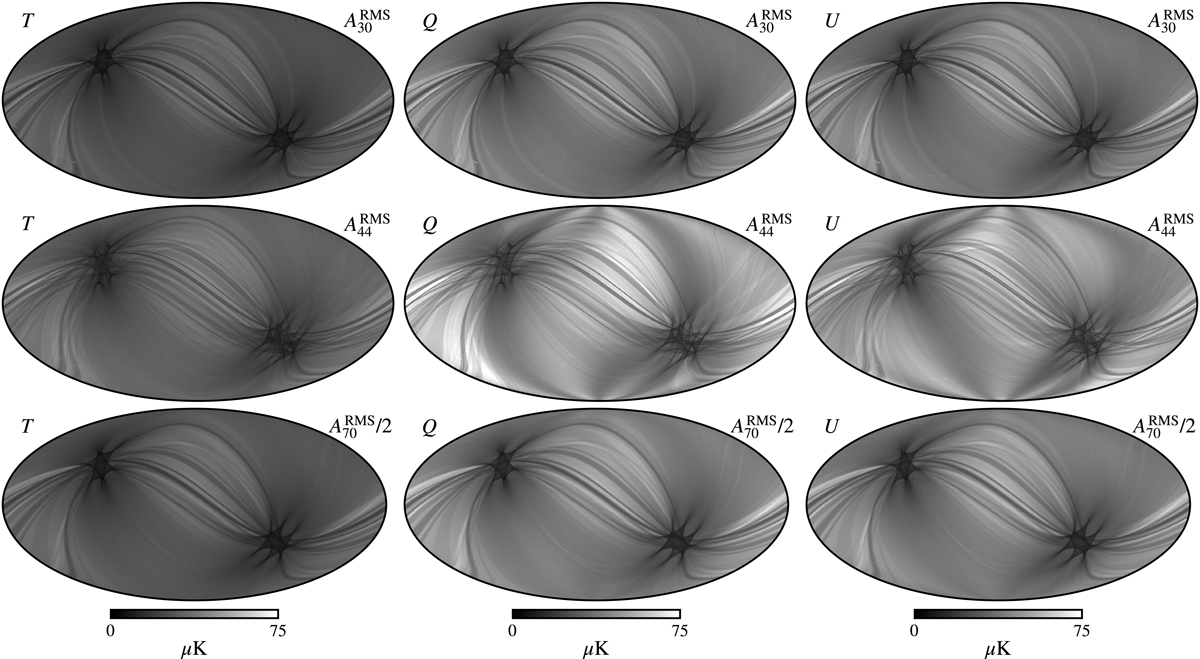
White noise standard deviation maps for a single arbitrarily selected sample. Rows show, from top to bottom, the 30, 44 and 70 GHz frequency channels, while columns show, from left to right, the temperature and Stokes Q and U parameters. Note that the 70 GHz maps are scaled by a factor of 2, to account for the fact that this map is pixelized at Nside = 1024, while the two lower frequencies are pixelized at Nside = 512.
Current usage metrics show cumulative count of Article Views (full-text article views including HTML views, PDF and ePub downloads, according to the available data) and Abstracts Views on Vision4Press platform.
Data correspond to usage on the plateform after 2015. The current usage metrics is available 48-96 hours after online publication and is updated daily on week days.
Initial download of the metrics may take a while.