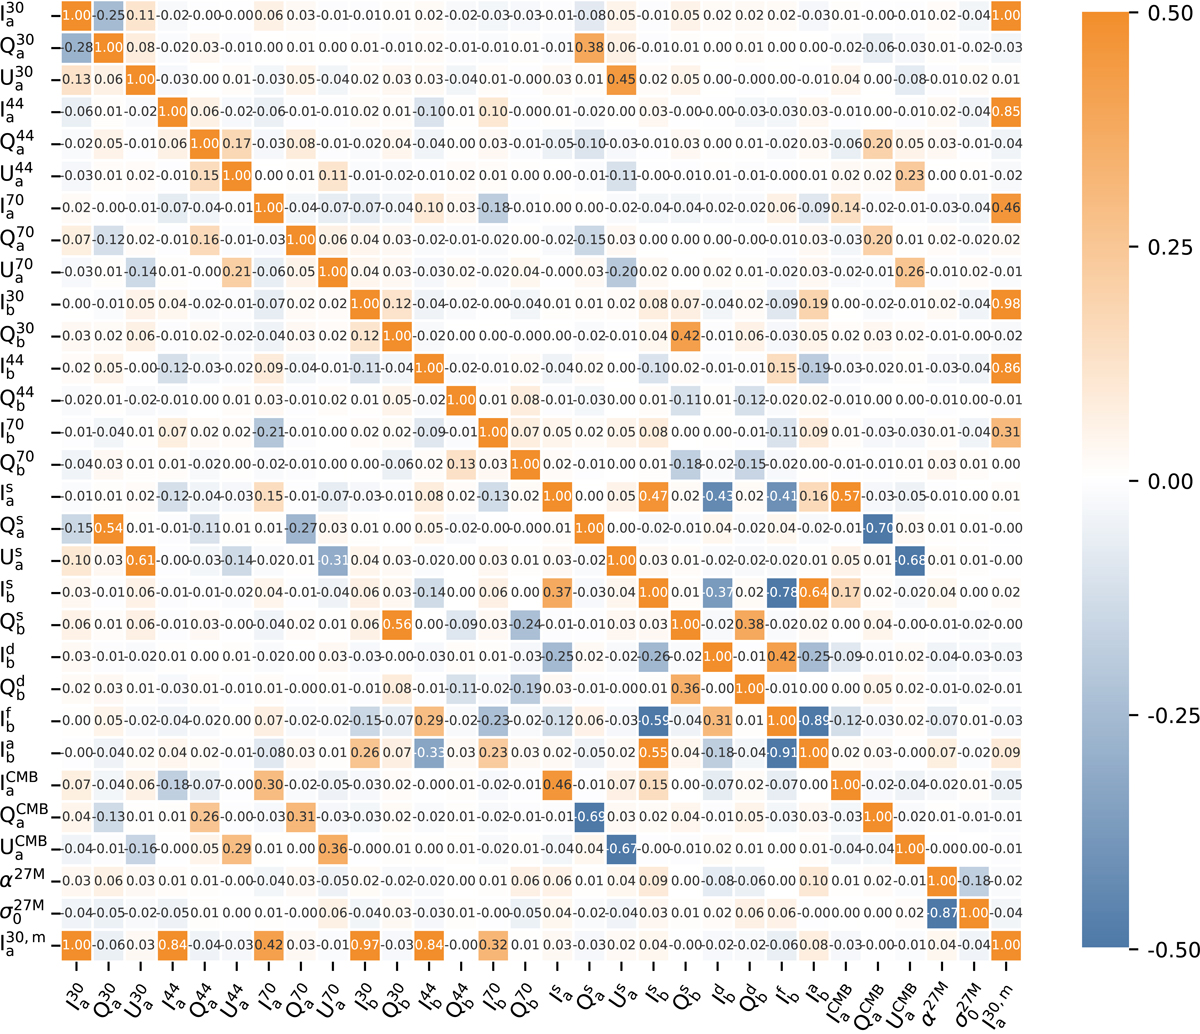
Fig. 3.
Download original image
Correlation coefficients between the same parameters as shown in Fig. 2. The subscripts a and b relate to the 340 and 1960 HEALPix pixel numbers. The lower triangle shows raw correlations, while the upper triangle shows correlations after high-pass filtering with a running mean with a 10-sample window. For further explanation of and motivation for this filtering, see Andersen et al. (2023).
Current usage metrics show cumulative count of Article Views (full-text article views including HTML views, PDF and ePub downloads, according to the available data) and Abstracts Views on Vision4Press platform.
Data correspond to usage on the plateform after 2015. The current usage metrics is available 48-96 hours after online publication and is updated daily on week days.
Initial download of the metrics may take a while.