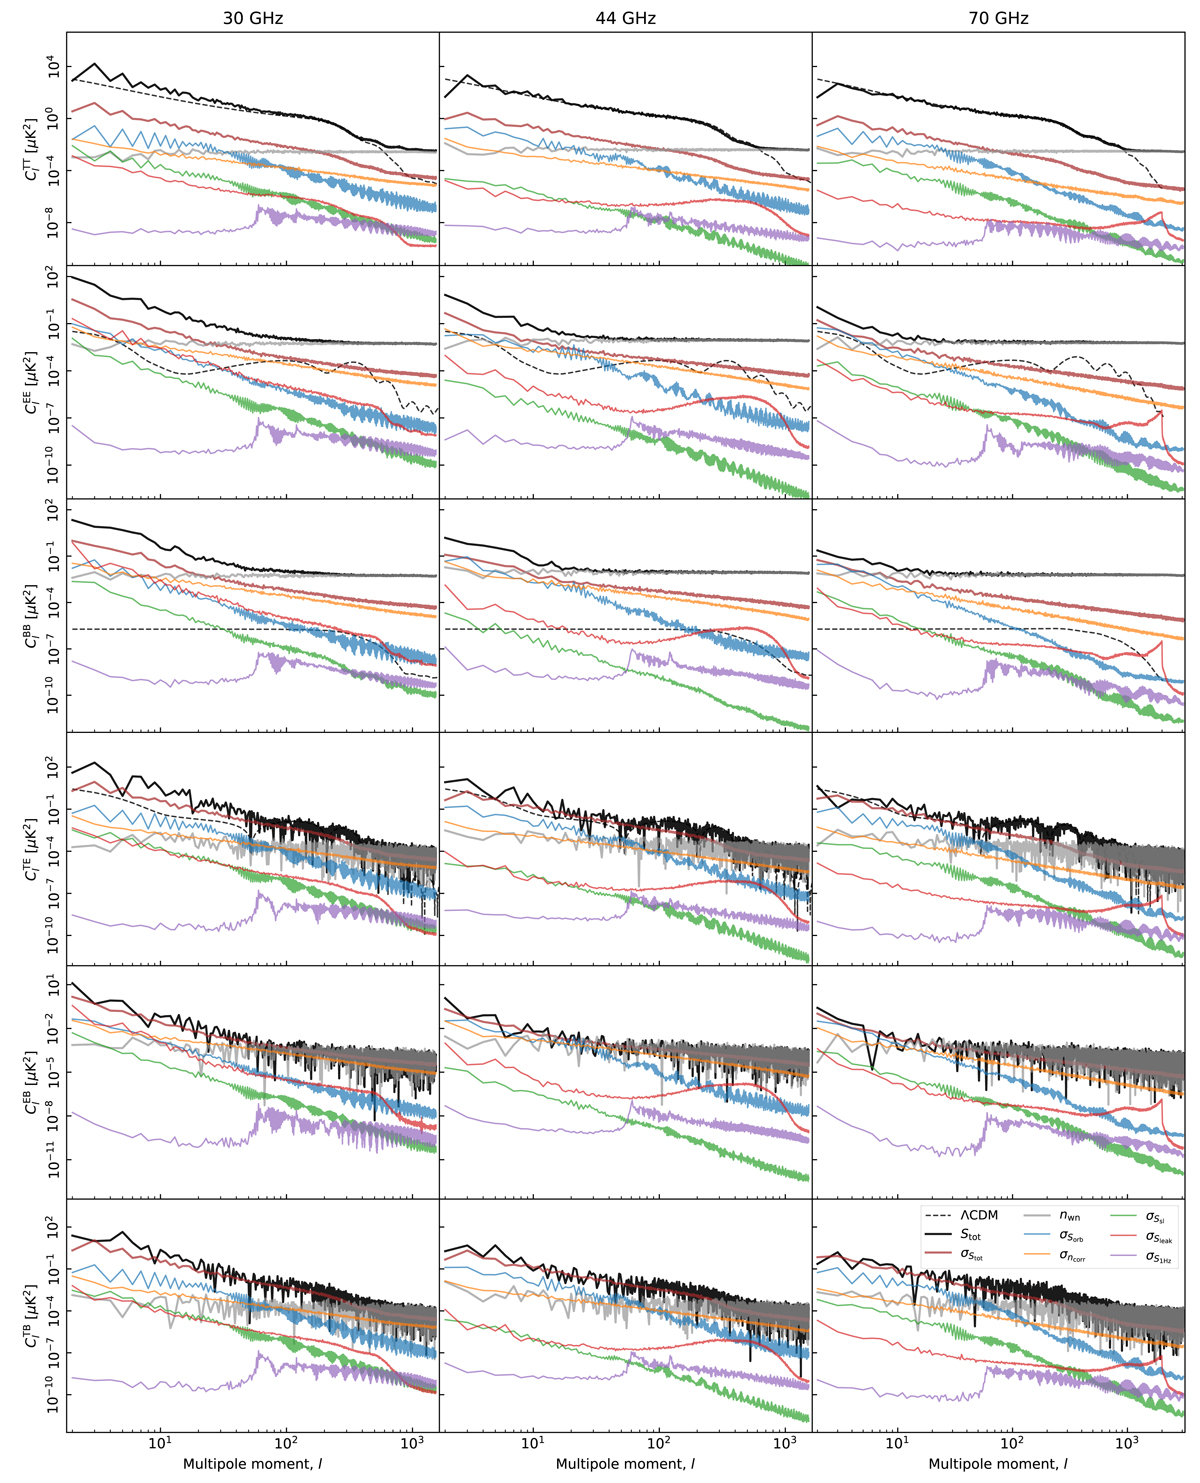
Fig. 23.
Download original image
Pseudo-spectrum standard deviation for each instrumental systematic correction shown in Figs. 20–22 (thin colored lines). For comparison, thick black lines show spectra for the full coadded frequency map; thick red lines show the standard deviation of the same (i.e., the full systematic uncertainty); gray lines show white noise; and dashed black lines show the best-fit Planck 2018 ΛCDM power spectrum convolved with the instrument beam. Columns show results for 30, 44 and 70 GHz, respectively, while rows show results for each of the six polarization states (TT, EE, BB, TE, TB, and EB). All spectra have been derived outside the CMB confidence mask presented by Andersen et al. (2023) using the HEALPix anafast utility, correcting only for sky fraction and not for mask mode coupling.
Current usage metrics show cumulative count of Article Views (full-text article views including HTML views, PDF and ePub downloads, according to the available data) and Abstracts Views on Vision4Press platform.
Data correspond to usage on the plateform after 2015. The current usage metrics is available 48-96 hours after online publication and is updated daily on week days.
Initial download of the metrics may take a while.