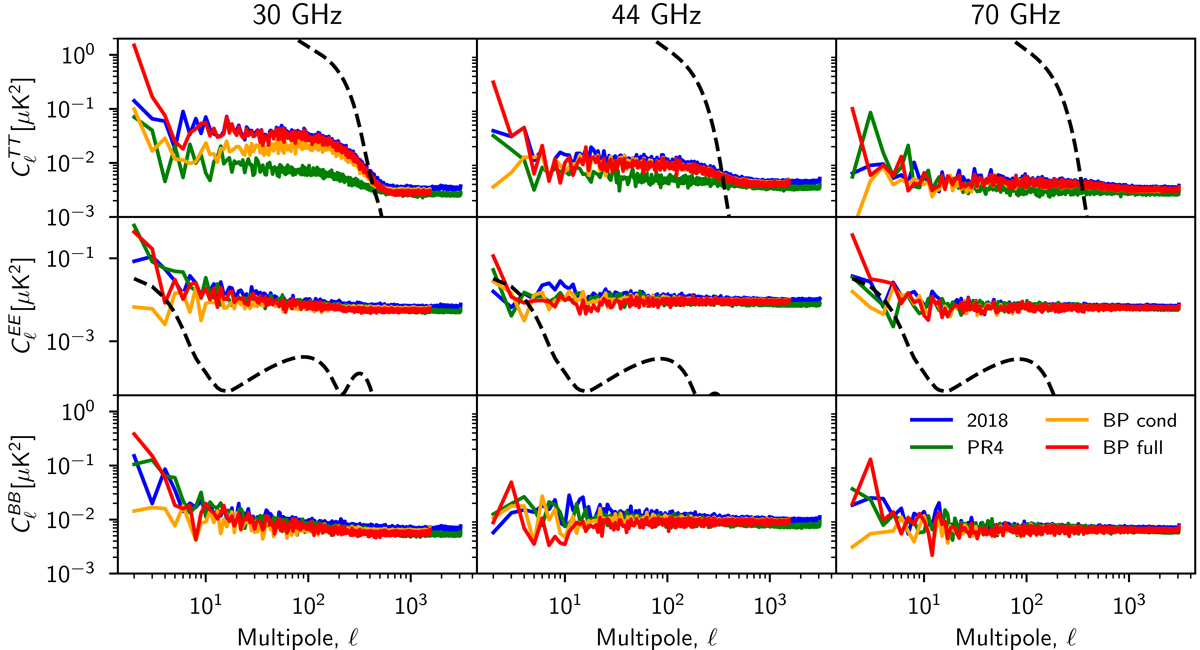
Fig. 19.
Download original image
Half-mission half-difference power spectra estimated by Planck 2018 (blue), Planck PR4 (green), and BEYONDPLANCK. In the case of BEYONDPLANCK, orange curves show spectra obtained from maps that are calibrated jointly (or “conditionally” with respect to the signal model), while red curves show spectra from maps that are processed completely independently. Columns show 30, 44, and 70 GHz results, while rows show TT, EE, and BB spectra. The dashed black line shows the best-fit Planck 2018 ΛCDM spectrum convolved with the instrument beam.
Current usage metrics show cumulative count of Article Views (full-text article views including HTML views, PDF and ePub downloads, according to the available data) and Abstracts Views on Vision4Press platform.
Data correspond to usage on the plateform after 2015. The current usage metrics is available 48-96 hours after online publication and is updated daily on week days.
Initial download of the metrics may take a while.