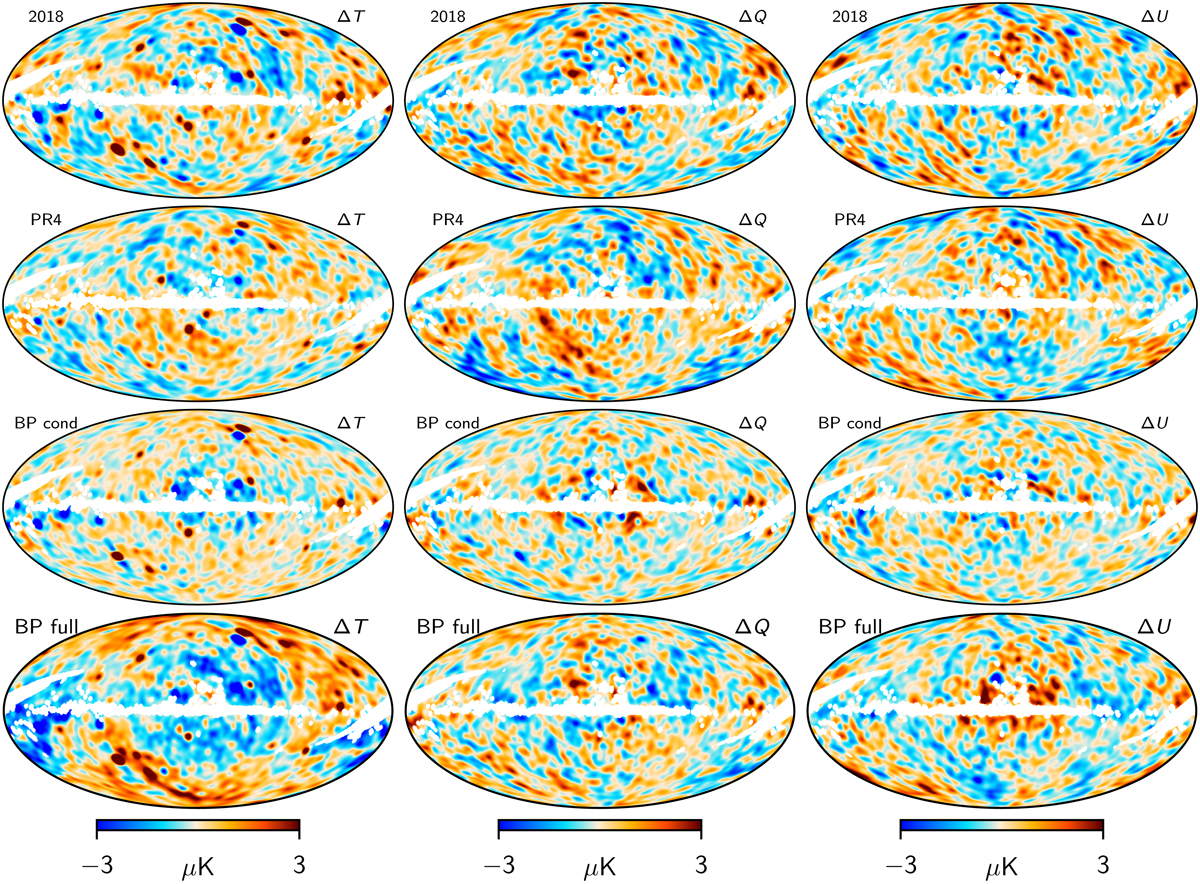
Fig. 18.
Download original image
Half mission difference maps for the 30 GHz channel. The top row shows the Planck data release 3 maps, while the second top row shows the difference for the Planck data release 4 maps. The bottom two rows show BP maps. The third row shows the first sample of a conditional run on astrophysical and instrumental parameters. The bottom row shows the difference between the half mission maps made from two independent runs that sample over the full model. The latter maps are averaged over 50 samples.
Current usage metrics show cumulative count of Article Views (full-text article views including HTML views, PDF and ePub downloads, according to the available data) and Abstracts Views on Vision4Press platform.
Data correspond to usage on the plateform after 2015. The current usage metrics is available 48-96 hours after online publication and is updated daily on week days.
Initial download of the metrics may take a while.