Fig. 15.
Download original image
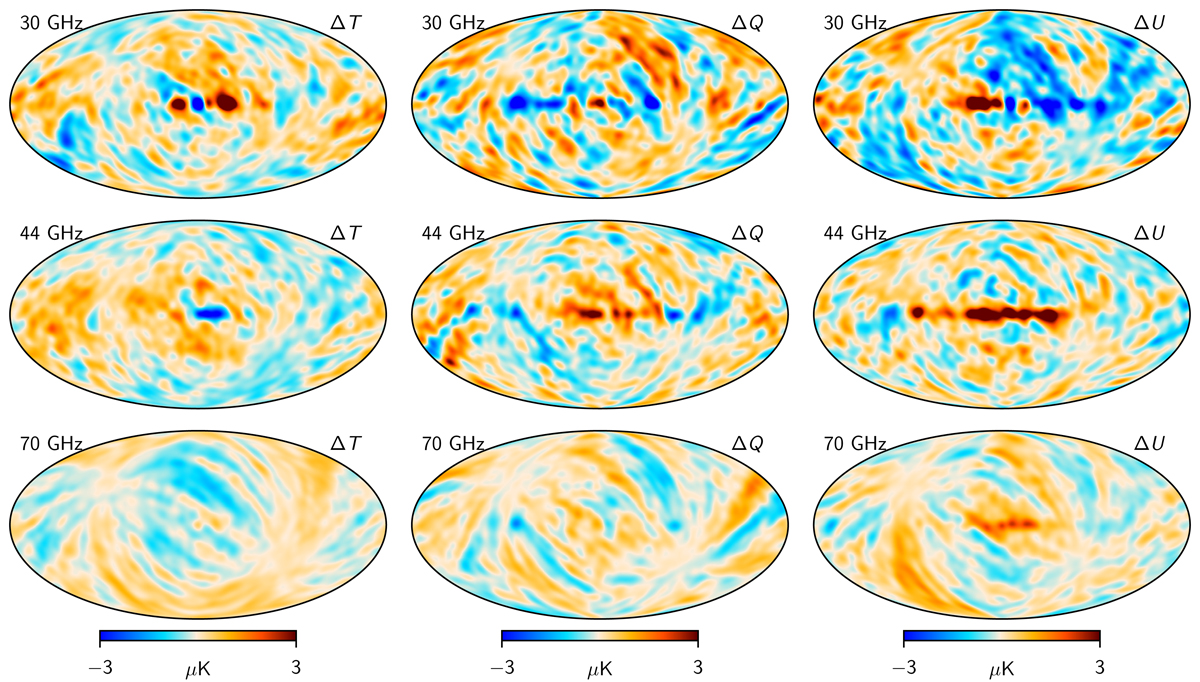
Difference maps between two frequency map samples, smoothed to a common angular resolution of 7° FWHM. Rows show, from top to bottom, the 30, 44 and 70 GHz frequency channels, while columns show, from left to right, the temperature and Stokes Q and U parameters. Monopoles of 2.8, 1.6, and −0.5 μK have been subtracted from the three temperature components, respectively.
Current usage metrics show cumulative count of Article Views (full-text article views including HTML views, PDF and ePub downloads, according to the available data) and Abstracts Views on Vision4Press platform.
Data correspond to usage on the plateform after 2015. The current usage metrics is available 48-96 hours after online publication and is updated daily on week days.
Initial download of the metrics may take a while.