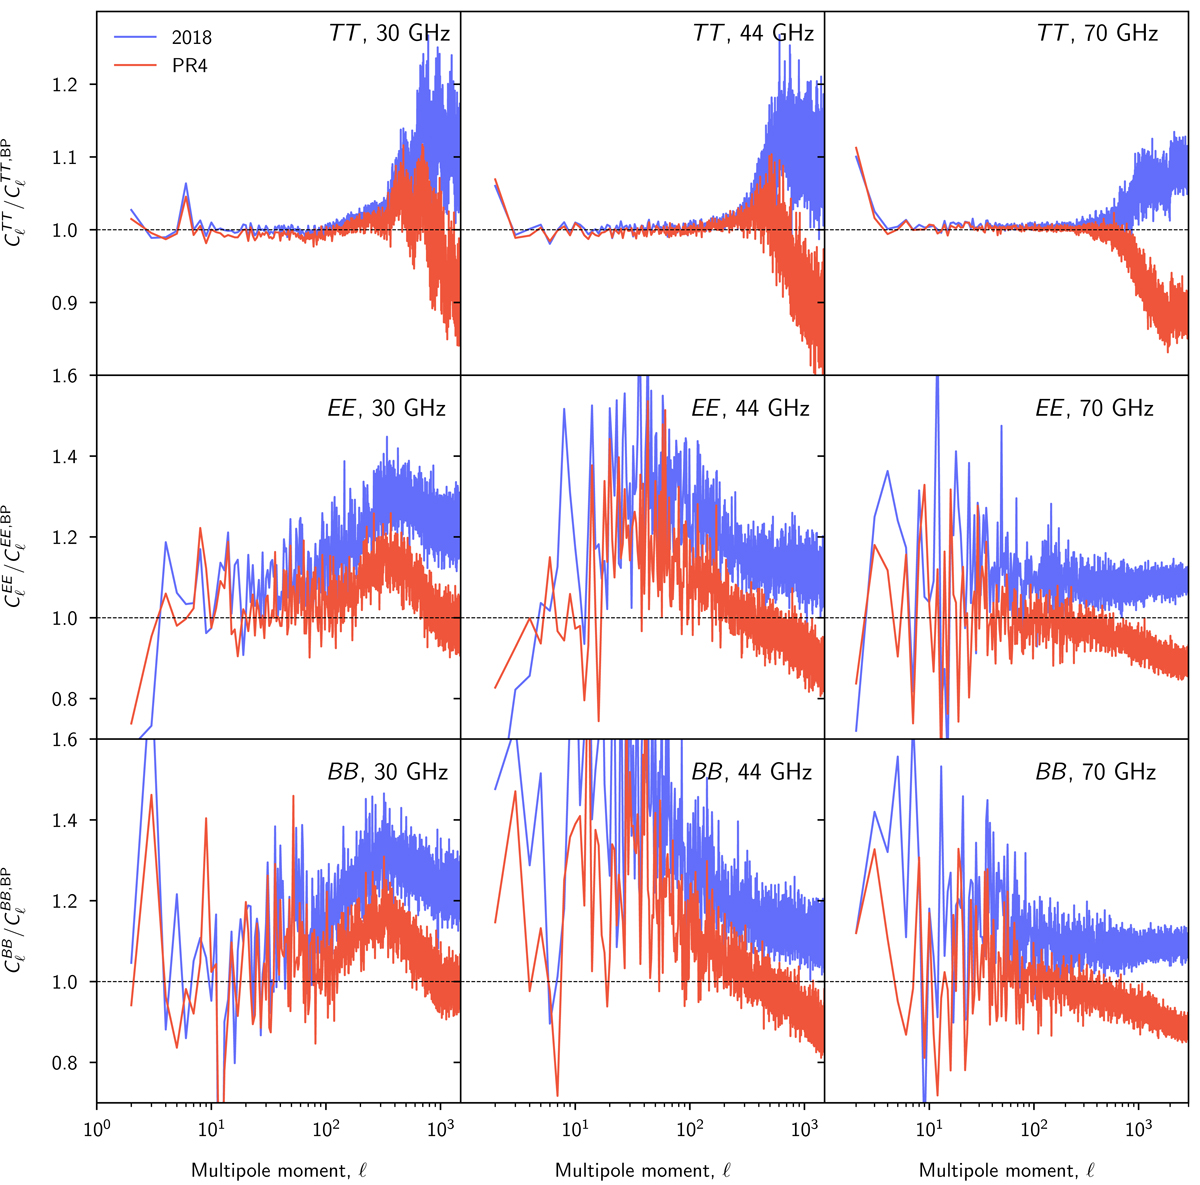
Fig. 14.
Download original image
Ratios between the angular auto-spectra shown in Fig. 12, adopting the BEYONDPLANCK spectra as reference. Planck 2018 results are shown as blue lines, while Planck PR4 results are shown as red lines. Values larger than unity imply that the respective map has more power than the corresponding BEYONDPLANCK spectrum.
Current usage metrics show cumulative count of Article Views (full-text article views including HTML views, PDF and ePub downloads, according to the available data) and Abstracts Views on Vision4Press platform.
Data correspond to usage on the plateform after 2015. The current usage metrics is available 48-96 hours after online publication and is updated daily on week days.
Initial download of the metrics may take a while.