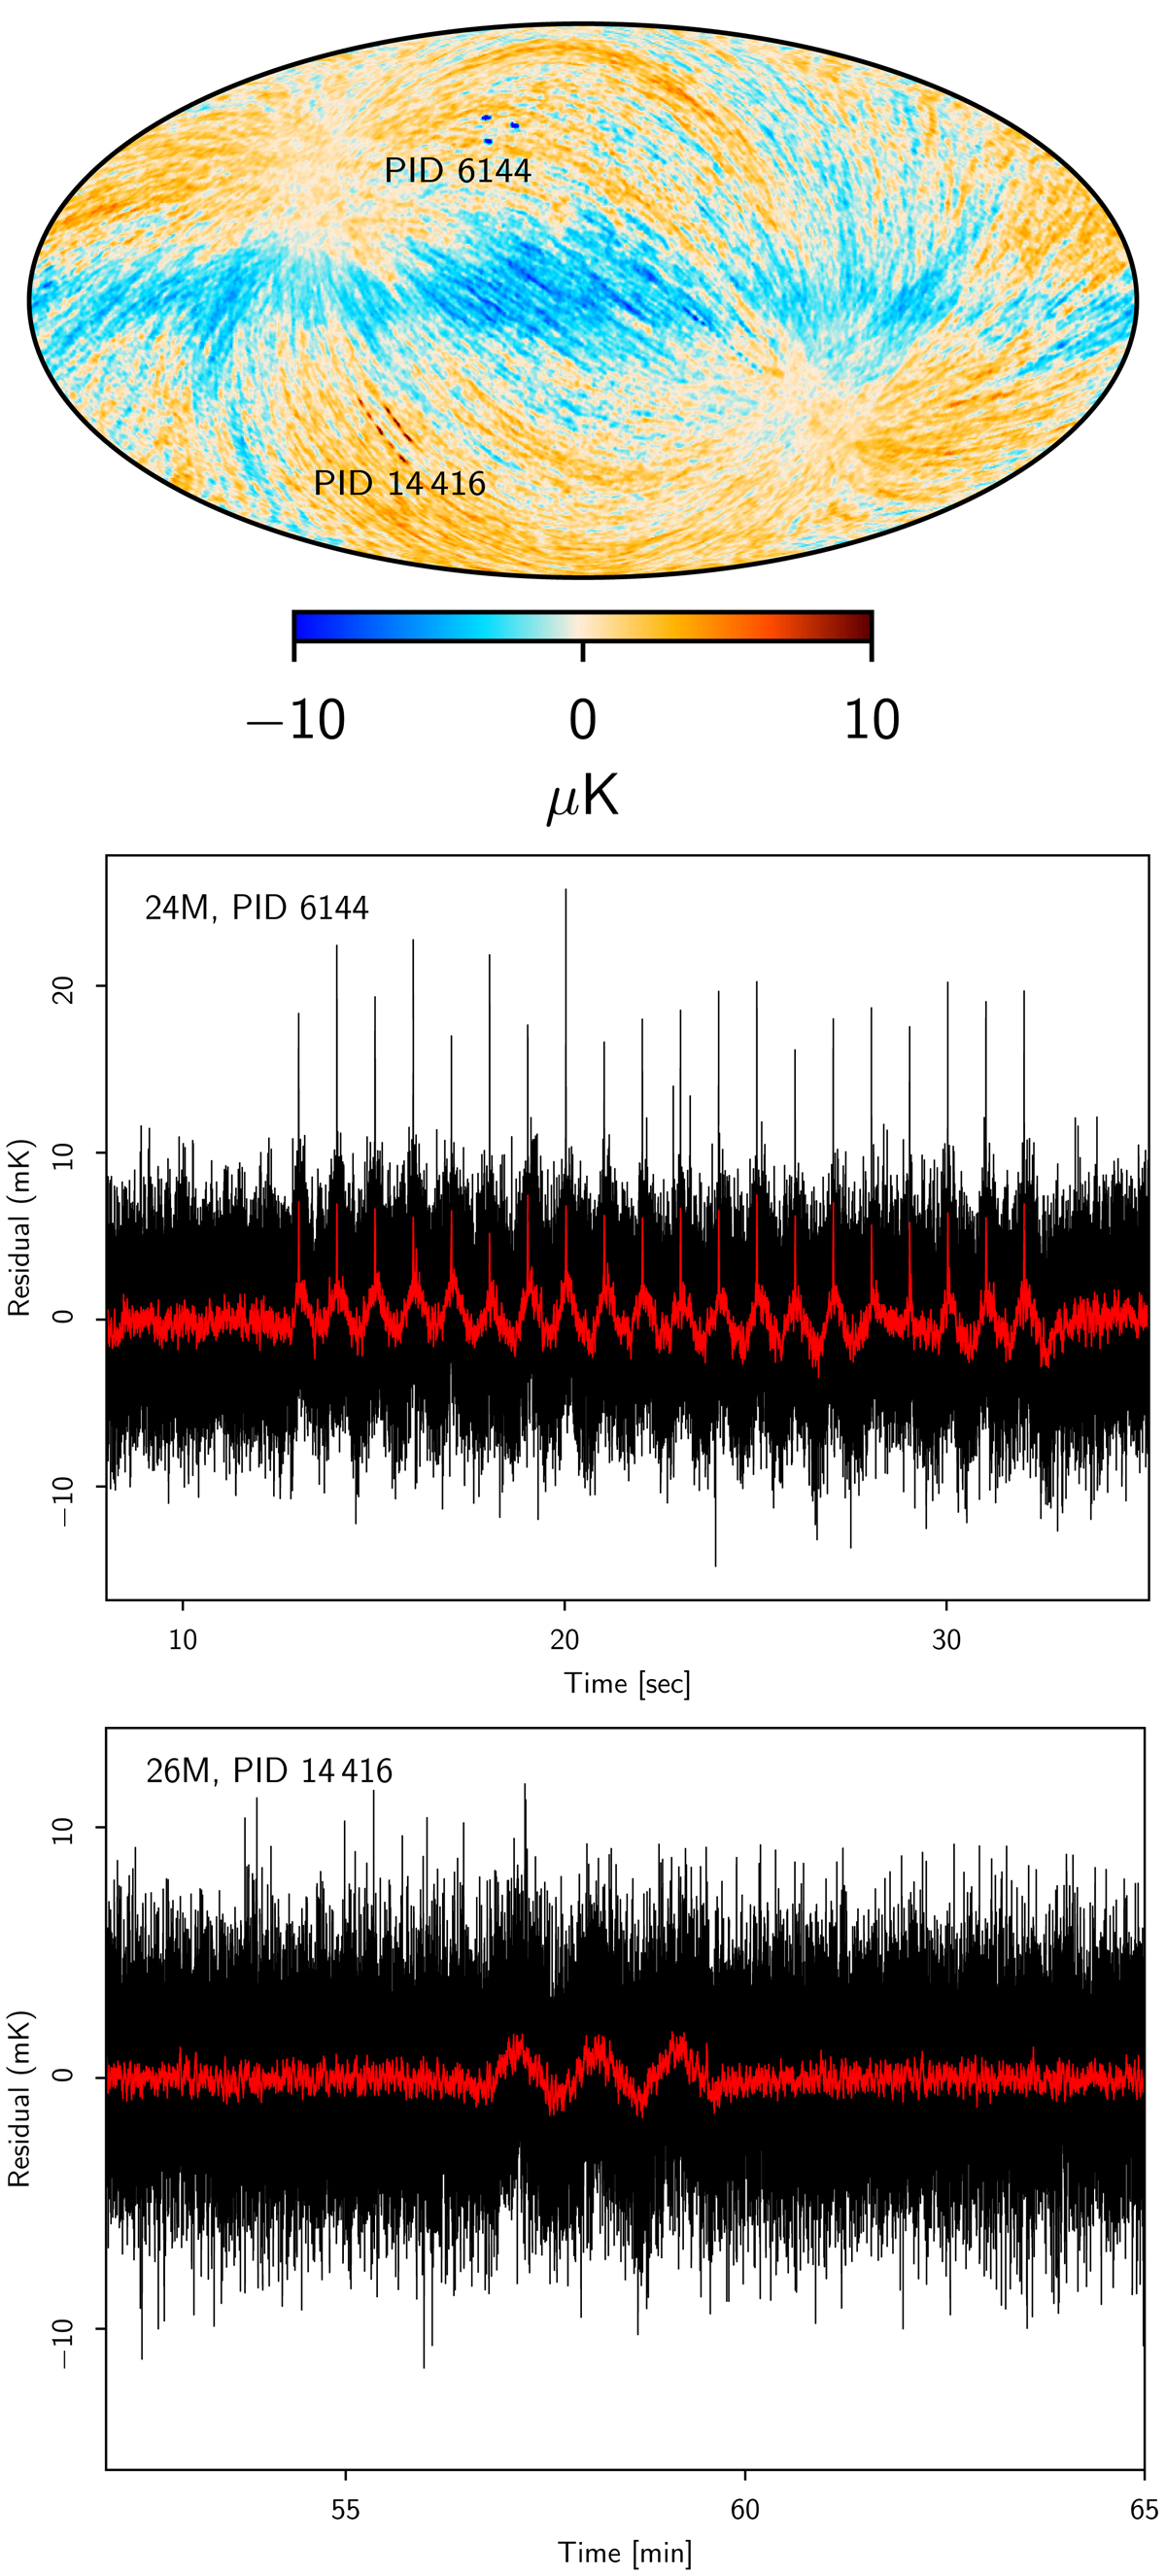
Fig. 10.
Download original image
Previously undetected TOD artifacts found by visual inspection of the (preliminary) correlated noise map for the 44 GHz channel shown in the top panel. The middle and lower panels show a zoom-in of the source PIDs, namely PID 6144 (for the “triangle feature”) and PID 14 416 (for the “dashed stripe feature”). In the two latter, the black curve shows the TOD residual, d − stot, for each sample, and the red curve shows the same after boxcar averaging with a 1 s window.
Current usage metrics show cumulative count of Article Views (full-text article views including HTML views, PDF and ePub downloads, according to the available data) and Abstracts Views on Vision4Press platform.
Data correspond to usage on the plateform after 2015. The current usage metrics is available 48-96 hours after online publication and is updated daily on week days.
Initial download of the metrics may take a while.