Fig. 9.
Download original image
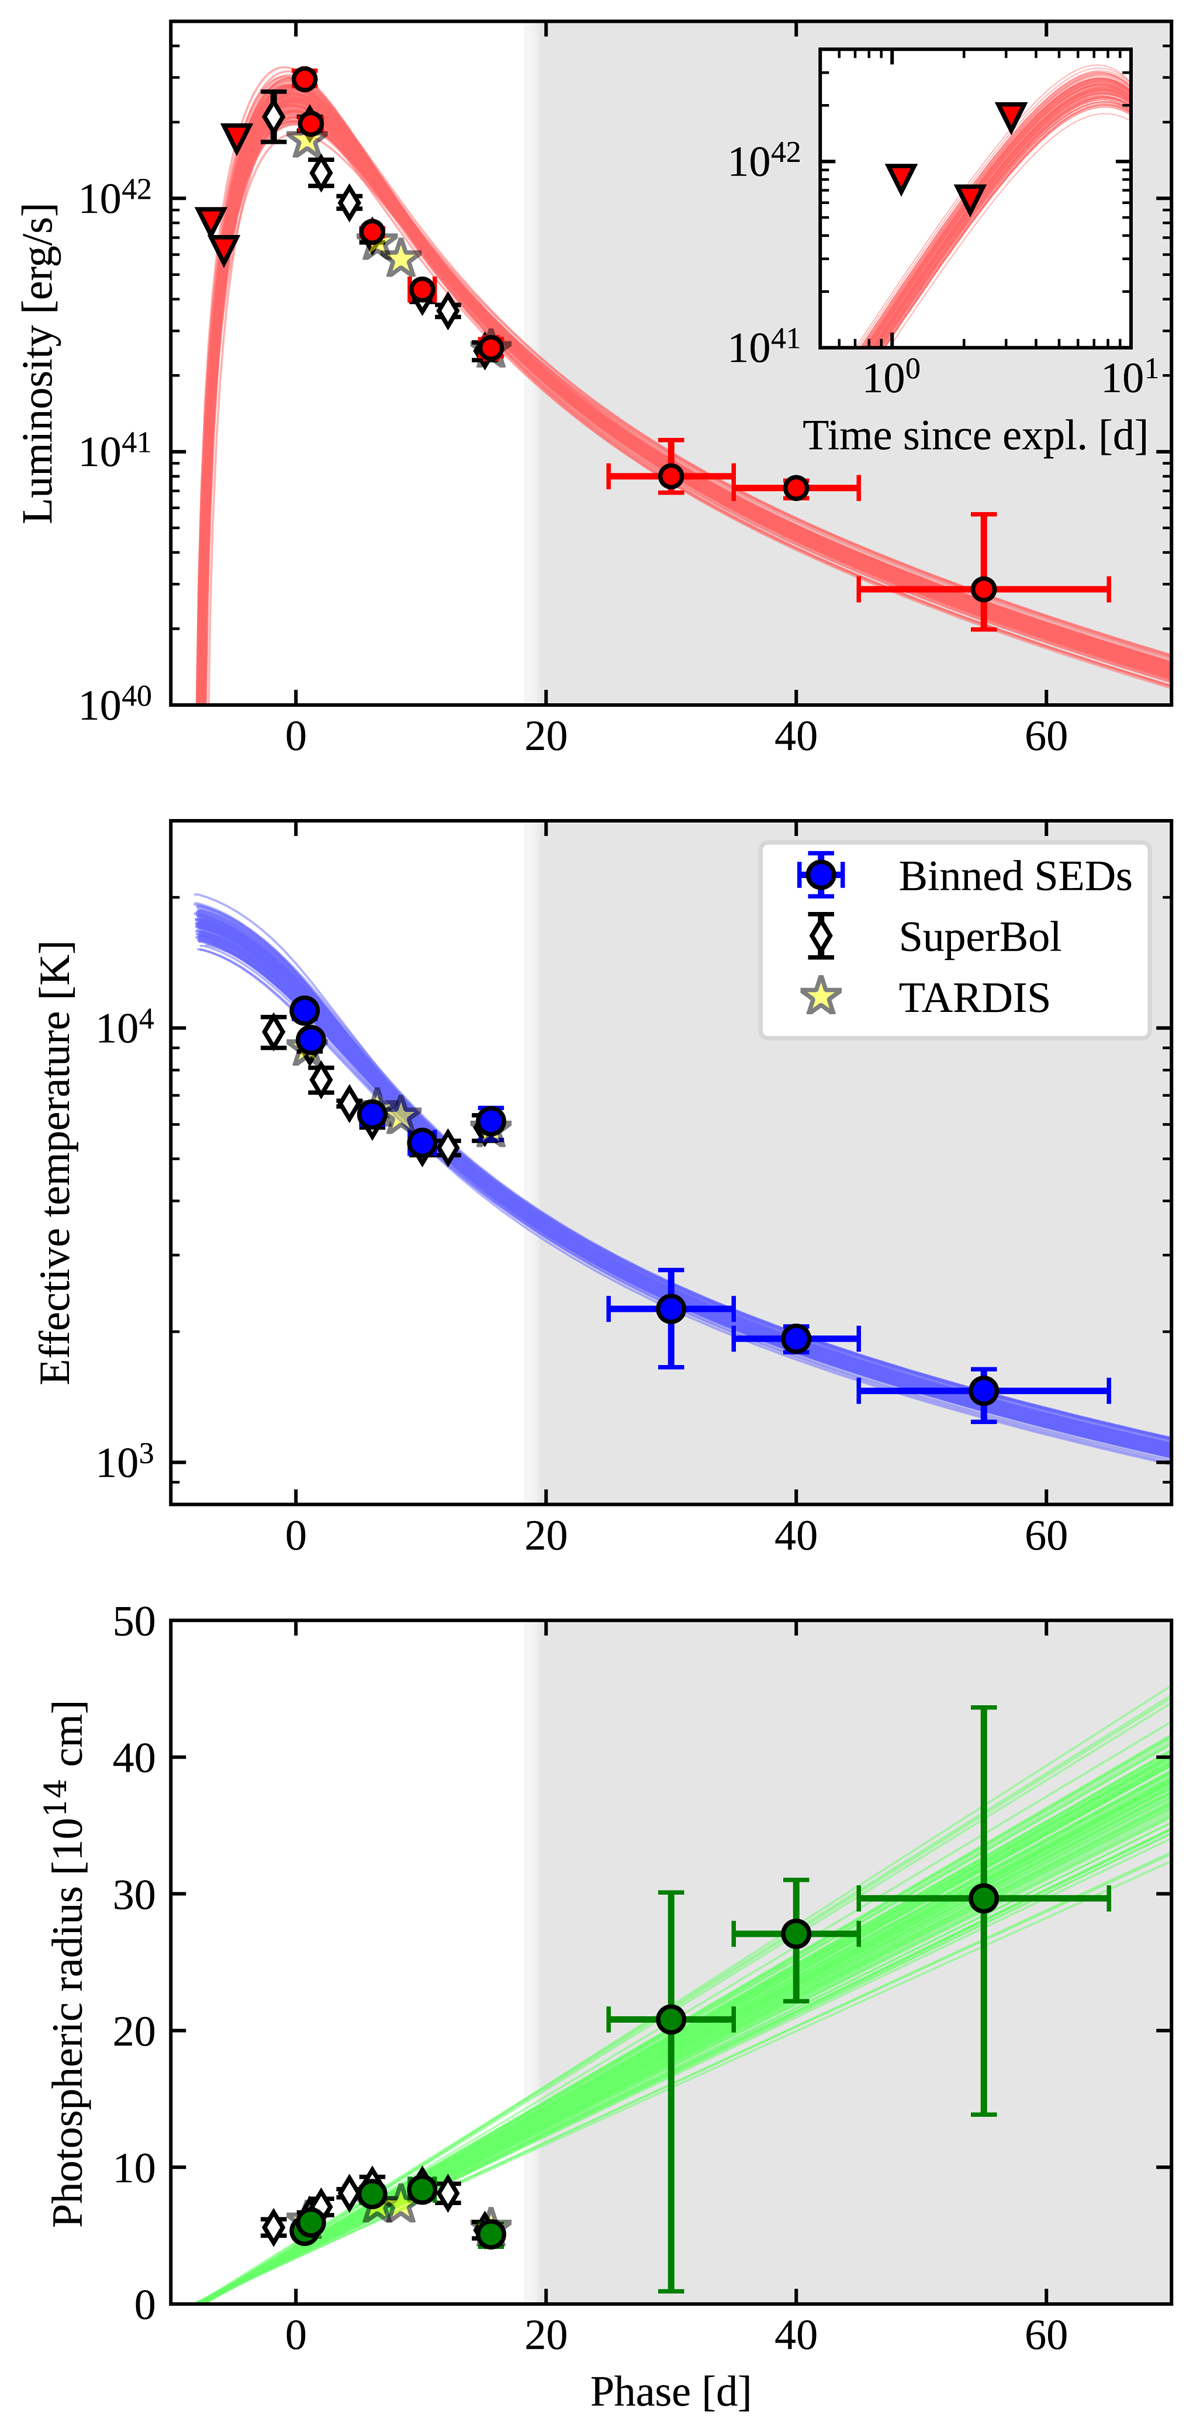
Evolution of photospheric quantities from blackbody fits to photometric data. The figure shows the luminosity (top panel), effective temperature (middle panel) and photospheric radius (bottom panel) derived from fitting a blackbody spectrum to our photometric data at various epochs (circles with error bars show results from MCMC fitting of binned SEDs; white diamonds show the SuperBol bolometric fit results; star symbols show the results from our TARDIS model – Sect. 4.4). Thin lines are 100 posterior samples from our simple SN model (Appendix C) fitted to the photometric dataset. The grey shaded area corresponds to times when the ejecta are formally optically thin (nebular phase). The inset in the top panel shows the model samples plotted against the time since explosion, with a logarithmic x-axis to better display the agreement with the upper limits. The latter are derived from our z-band upper limits assuming the blackbody spectrum corresponding to the best-fit model.
Current usage metrics show cumulative count of Article Views (full-text article views including HTML views, PDF and ePub downloads, according to the available data) and Abstracts Views on Vision4Press platform.
Data correspond to usage on the plateform after 2015. The current usage metrics is available 48-96 hours after online publication and is updated daily on week days.
Initial download of the metrics may take a while.