Fig. 8.
Download original image
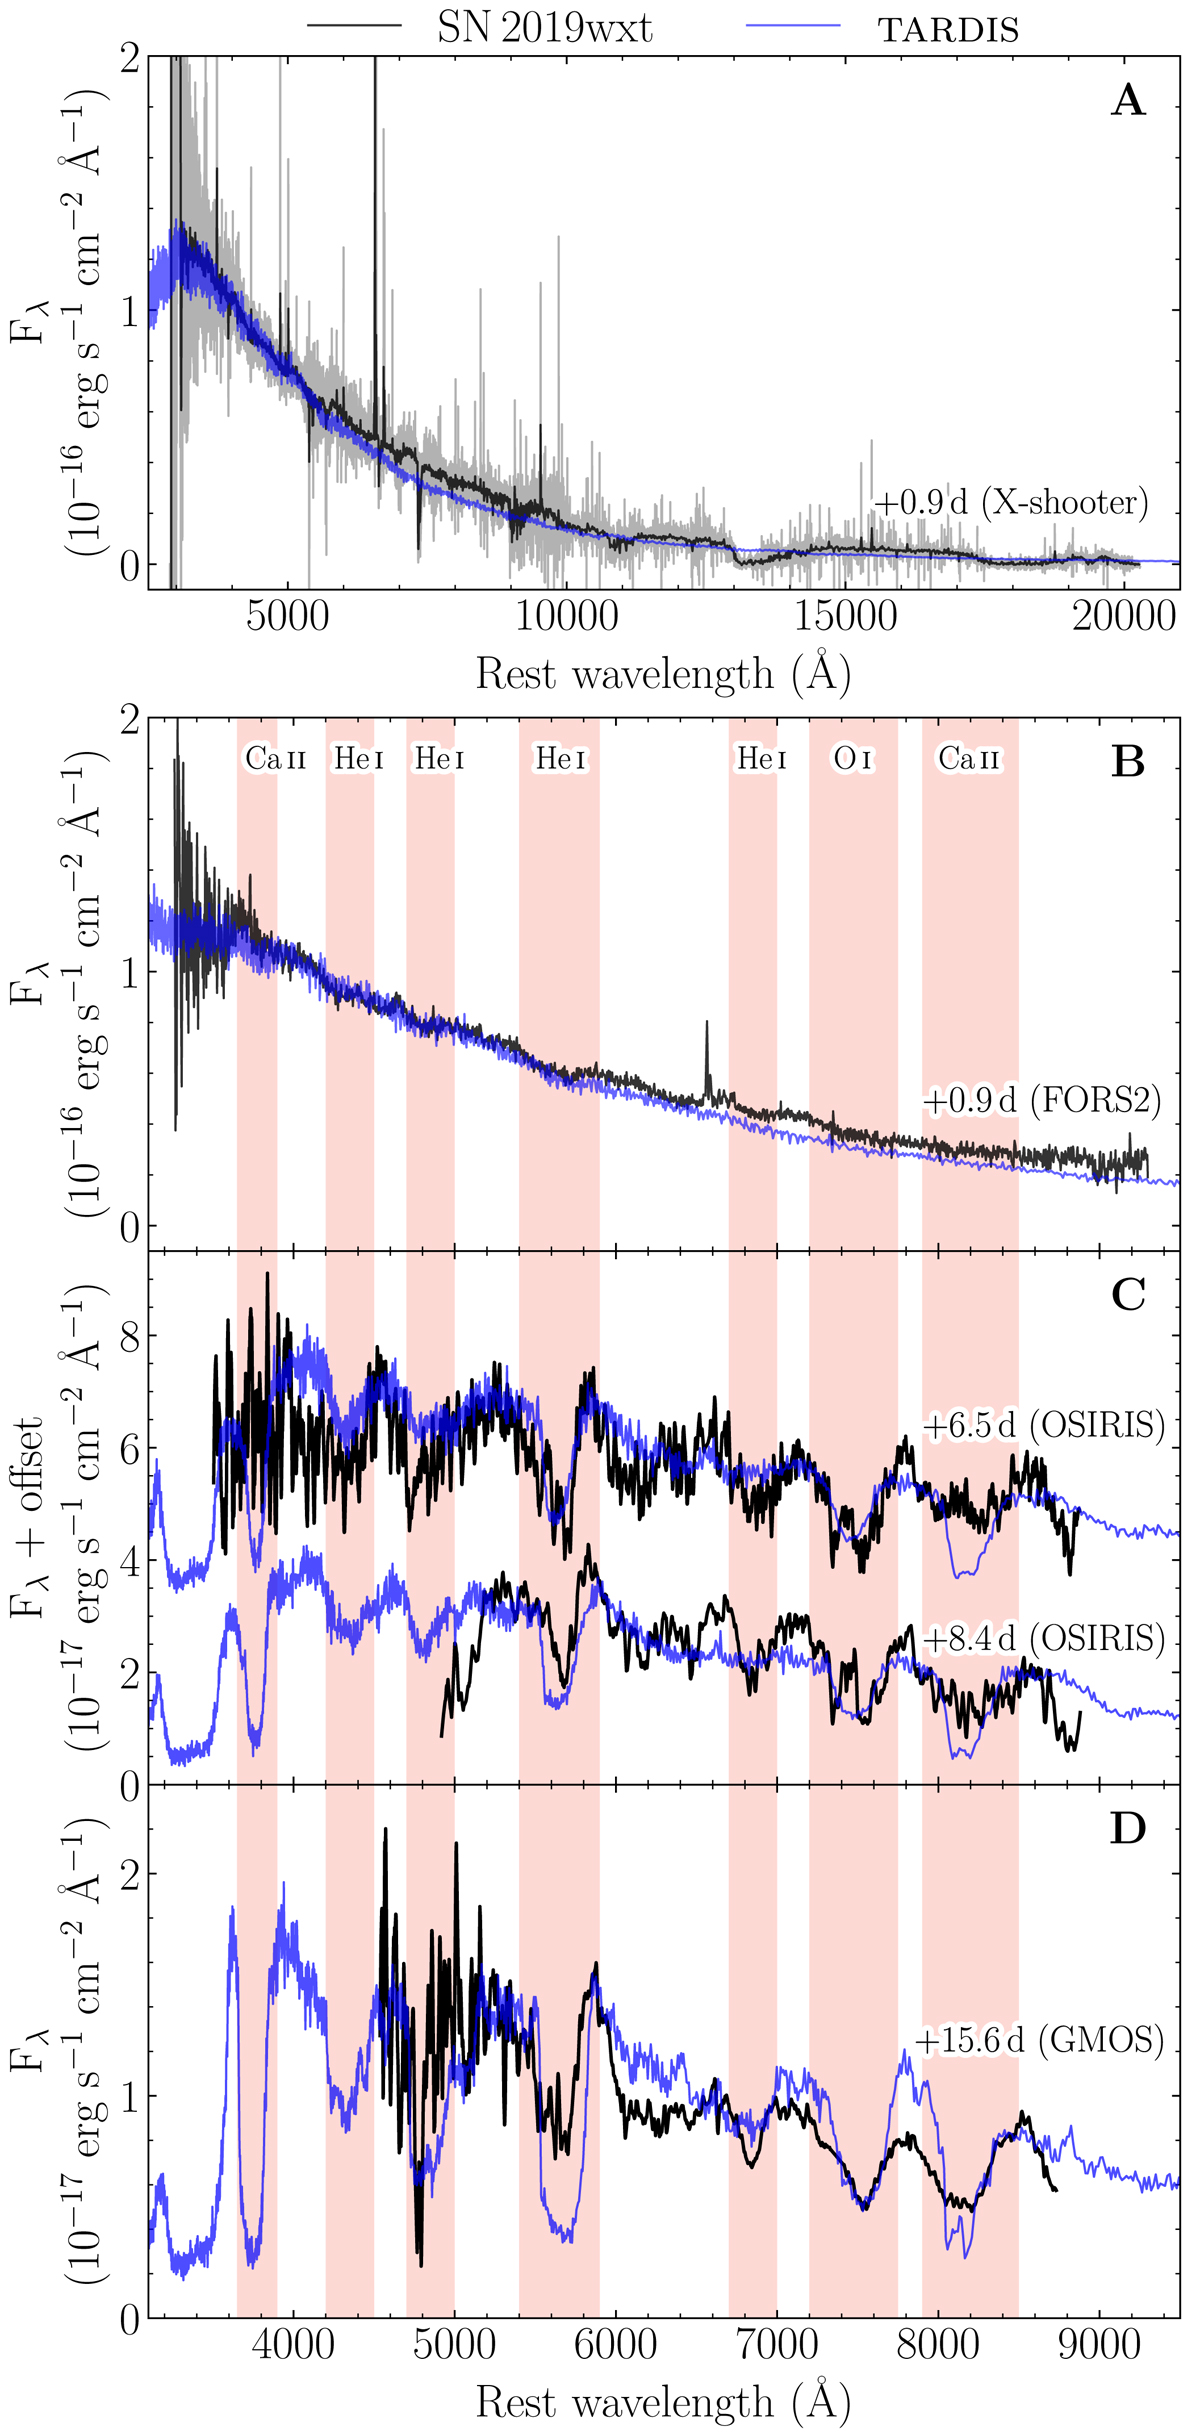
Comparisons between our model spectra (blue) and observations (black). The observed spectra have been rebinned by a factor of 10 (using SPECTRES, Carnall 2017). Panel A: Comparison of the +0.9 d X-shooter spectrum with our best-fitting TARDIS model. Panel B: Comparison of the early FORS2 spectrum (+0.9 d), and our best-fitting TARDIS model. Panel C: Comparison of the two later OSIRIS spectra (+6.5 and +8.4 d) with their corresponding TARDIS models. The +6.5 d spectrum and model have been offset by 3 × 10⁻¹⁷ erg s−1 cm−2 Å−1, for clarity. Panel D: Comparison of the late-time GMOS spectrum (+15.6 d), and its corresponding TARDIS model. The vertical shaded bands in panels B, C and D correspond to regions of absorption in the observed spectra. The species dominating these same absorption features in our best-fitting TARDIS models have added to the top of each band in panel B.
Current usage metrics show cumulative count of Article Views (full-text article views including HTML views, PDF and ePub downloads, according to the available data) and Abstracts Views on Vision4Press platform.
Data correspond to usage on the plateform after 2015. The current usage metrics is available 48-96 hours after online publication and is updated daily on week days.
Initial download of the metrics may take a while.