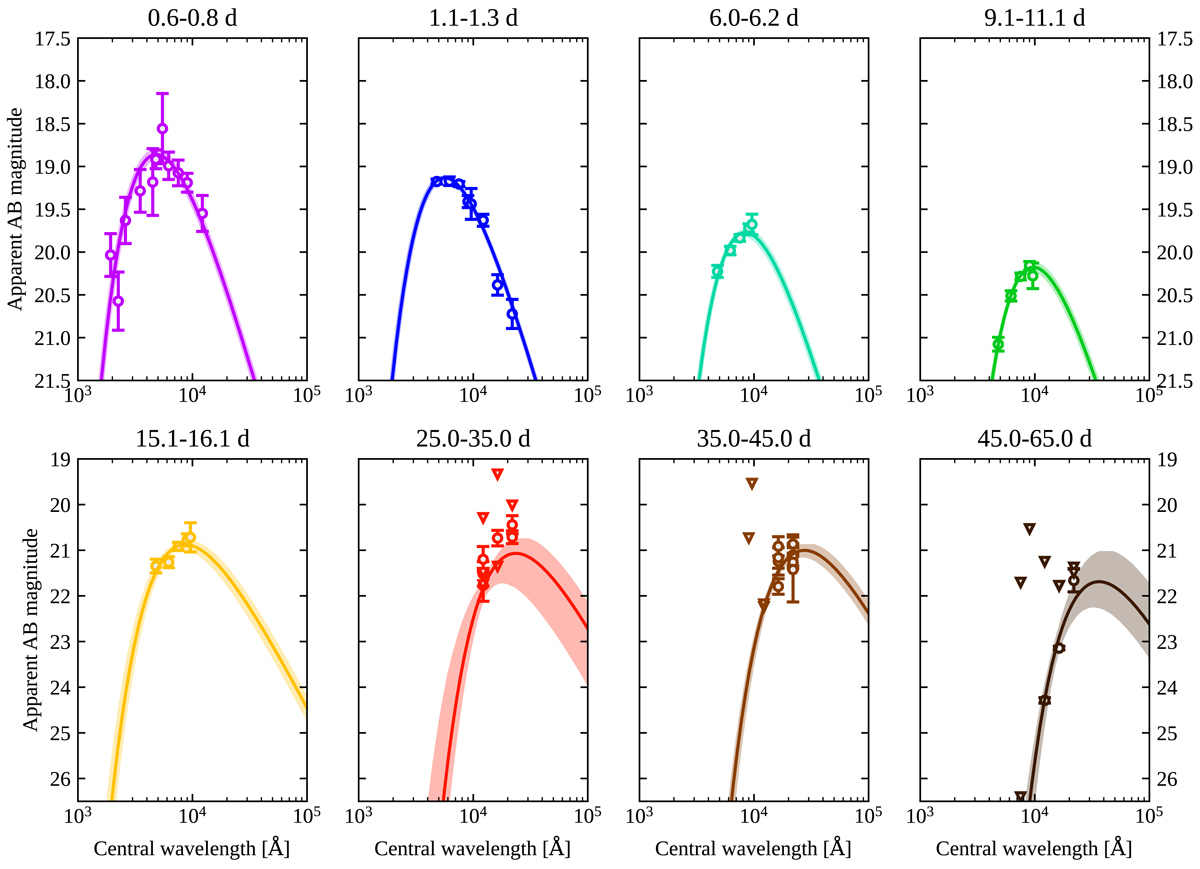
Fig. 7.
Download original image
Spectral energy distributions fitted with a blackbody model. Each panel shows a SED of SN2019wxt (circles represent detections with one-sigma error bars; triangles represent upper limits) constructed by considering photometric measurements binned within a time window (annotated above each panel, in days post i-band maximum). The formally best-fitting blackbody is shown by a solid line, while the filled regions span the 16th to the 84th percentile (equivalent to one-sigma uncertainties) of the model magnitudes corresponding to the posterior samples at each wavelength. The fits are performed adopting a log-uniform prior on the BB luminosity in the 1035 − 1043 erg/s range and a uniform prior on the temperature in the 1000 − 20 000 K range.
Current usage metrics show cumulative count of Article Views (full-text article views including HTML views, PDF and ePub downloads, according to the available data) and Abstracts Views on Vision4Press platform.
Data correspond to usage on the plateform after 2015. The current usage metrics is available 48-96 hours after online publication and is updated daily on week days.
Initial download of the metrics may take a while.