Fig. 6.
Download original image
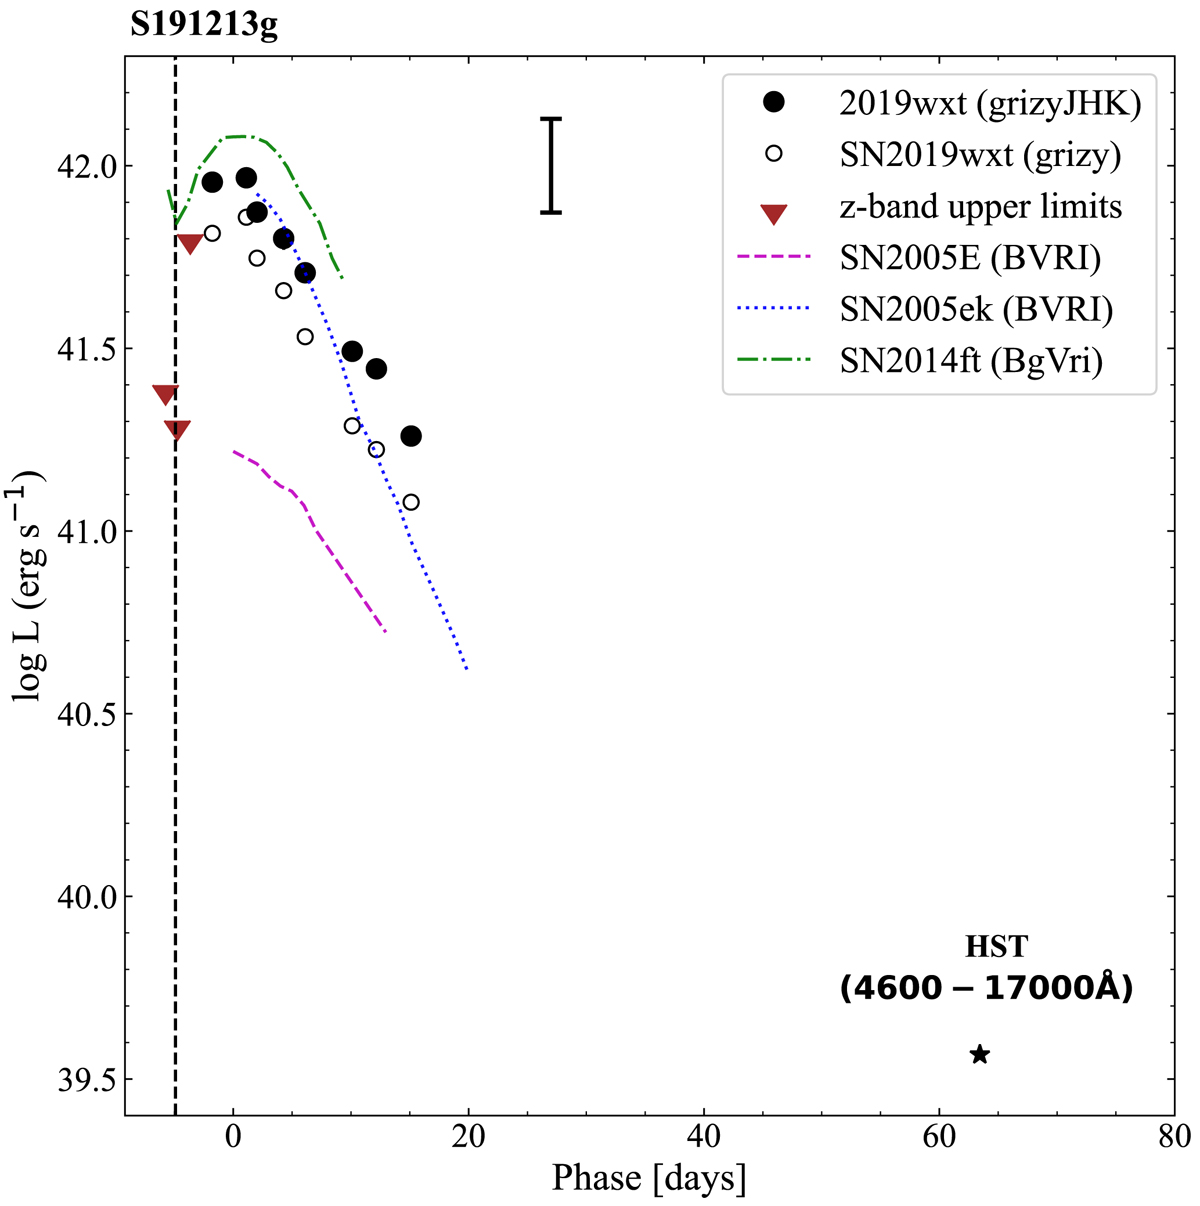
Quasi-bolometric grizyJHK light curve of SN 2019wxt, together with our late time HST measurement. Also shown are the quasi-bolometric light curves of the fast declining ultra-stripped SNe 2005E (Perets et al. 2010), 2005ek (Drout et al. 2013) and 2014ft (De et al. 2018) for comparison. The dashed vertical line indicates the time at which the GW event occurred. The errorbar represents the systematic error that stems from the uncertainty on the distance modulus.
Current usage metrics show cumulative count of Article Views (full-text article views including HTML views, PDF and ePub downloads, according to the available data) and Abstracts Views on Vision4Press platform.
Data correspond to usage on the plateform after 2015. The current usage metrics is available 48-96 hours after online publication and is updated daily on week days.
Initial download of the metrics may take a while.