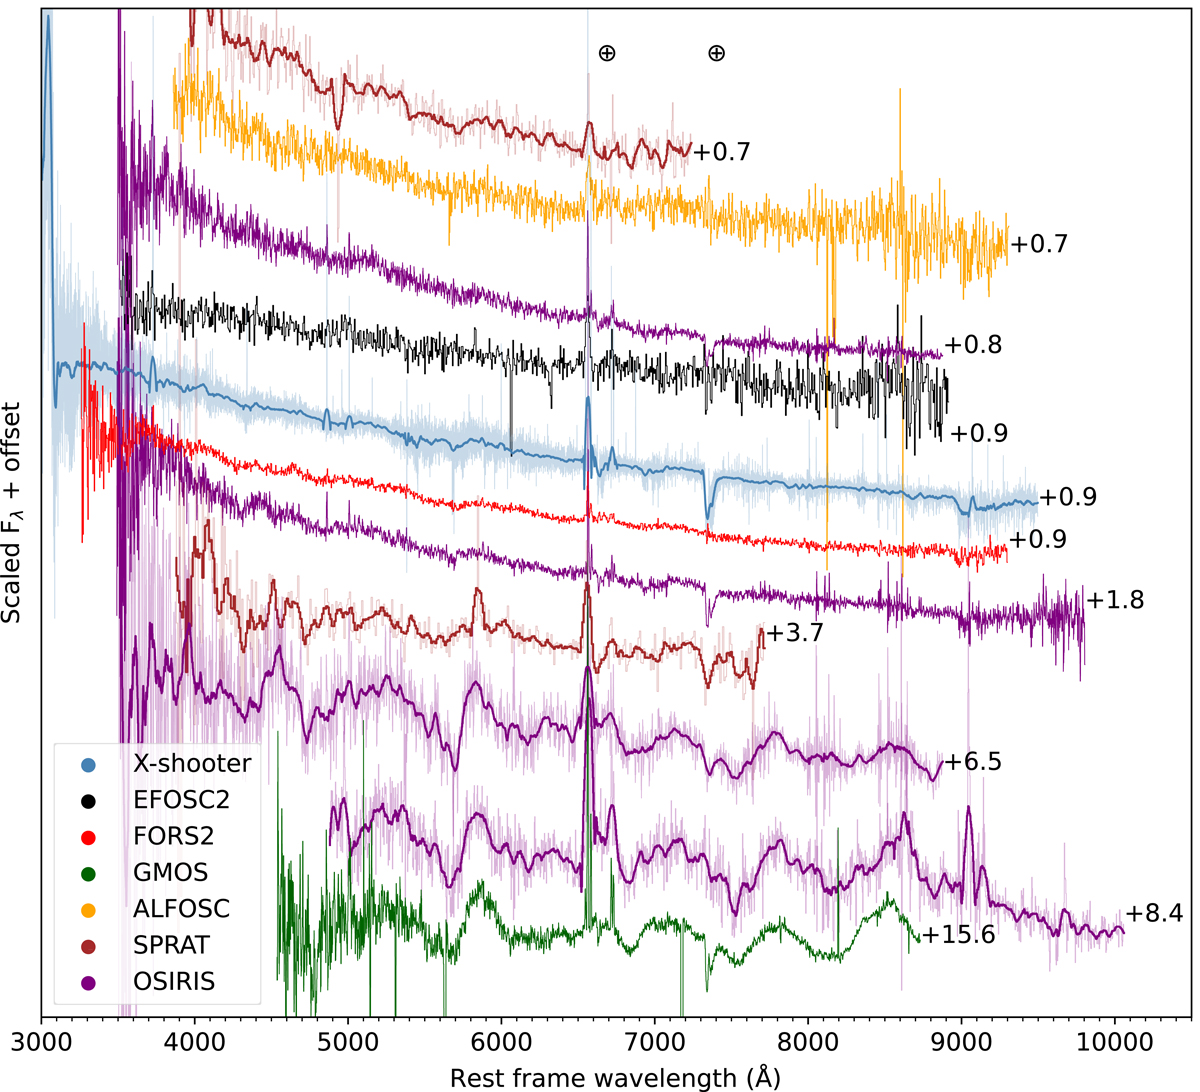
Fig. 4.
Download original image
Sequence of optical spectra obtained of SN 2019wxt. The phase (in rest frame days relative to our adopted i-band maximum MJD 58835.1) is listed beside each spectrum. Telluric absorptions are indicated with a ⊕ symbol. In the case of the X-shooter, SPRAT and OSIRIS data, we plot a smoothed version of each spectrum, with the unsmoothed spectrum shown underneath in a lighter colour. Smoothed spectra have had a Savitzky-Golay filter applied, with window length of 50 Å for the X-Shooter data, and 100 Å for the SPRAT and OSIRIS spectra.
Current usage metrics show cumulative count of Article Views (full-text article views including HTML views, PDF and ePub downloads, according to the available data) and Abstracts Views on Vision4Press platform.
Data correspond to usage on the plateform after 2015. The current usage metrics is available 48-96 hours after online publication and is updated daily on week days.
Initial download of the metrics may take a while.