Open Access
Fig. 2.
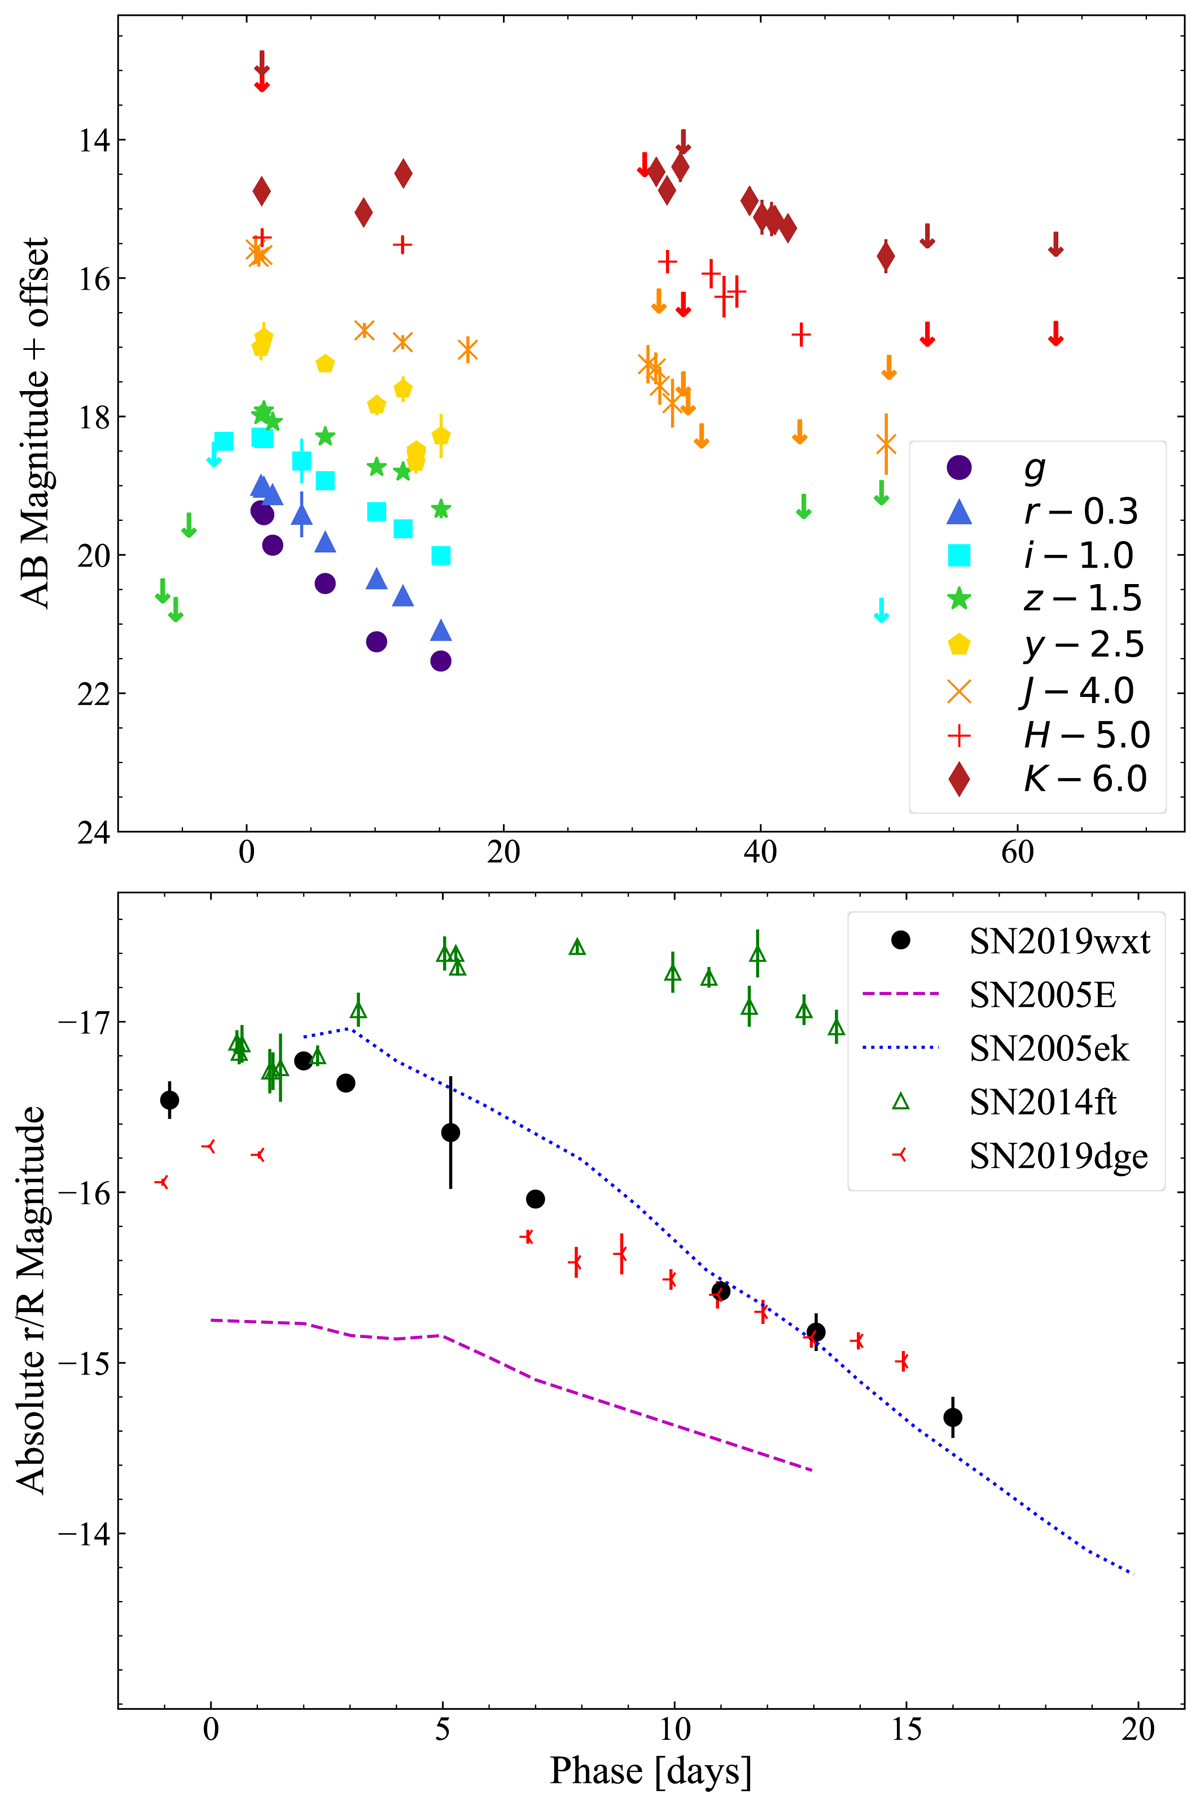
Download original image
Light curves. Top panel: grizyJHK light curves of SN 2019wxt. Lower panel: Comparison of absolute r and R-band light curves with those of other faint and rapidly evolving transients. For both panels, the phase is given with respect to the epoch of i-band maximum, i.e. MJD 58835.1.
Current usage metrics show cumulative count of Article Views (full-text article views including HTML views, PDF and ePub downloads, according to the available data) and Abstracts Views on Vision4Press platform.
Data correspond to usage on the plateform after 2015. The current usage metrics is available 48-96 hours after online publication and is updated daily on week days.
Initial download of the metrics may take a while.