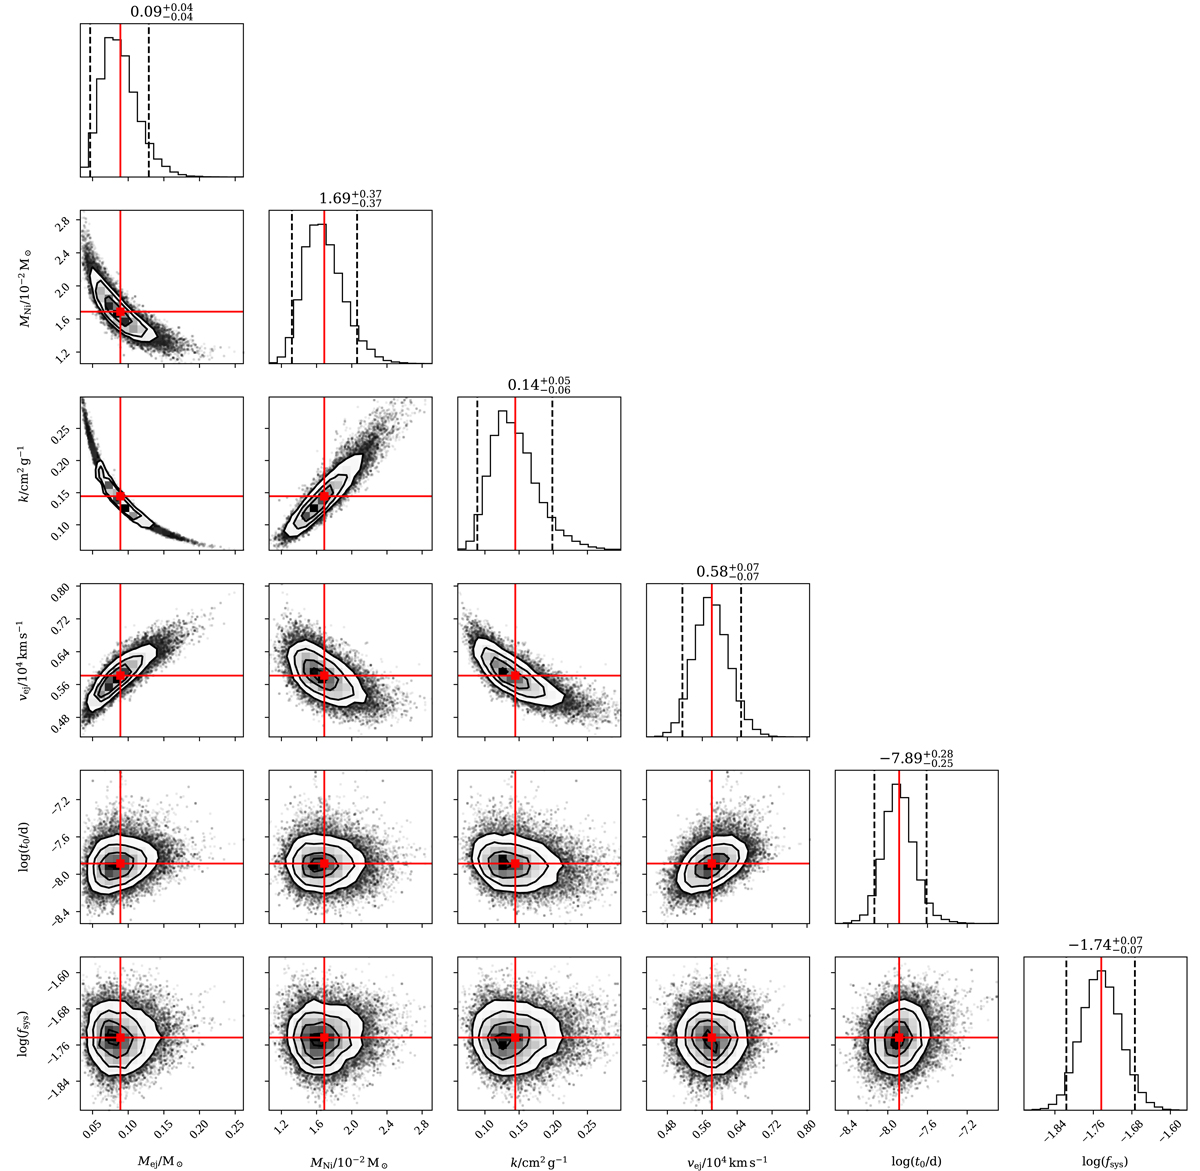
Fig. C.1.
Download original image
Corner plot showing marginalised one-dimensional and 2-dimensional posterior probability densities on the SN model parameters obtained by fitting the SN 2019wxt photometric dataset. The red lines and square markers show the estimated position of the maximum a posteriori. Dashed lines in the plots on the diagonal bracket 90% credible ranges. Contours in the two-dimensional plots show credible regions at the 68%, 95% and 99.7% credible level, while black dots are random samples from the posterior, qualitatively showing the behaviour outside the contours. The physical meaning of the parameters is described in the text.
Current usage metrics show cumulative count of Article Views (full-text article views including HTML views, PDF and ePub downloads, according to the available data) and Abstracts Views on Vision4Press platform.
Data correspond to usage on the plateform after 2015. The current usage metrics is available 48-96 hours after online publication and is updated daily on week days.
Initial download of the metrics may take a while.