Fig. 14.
Download original image
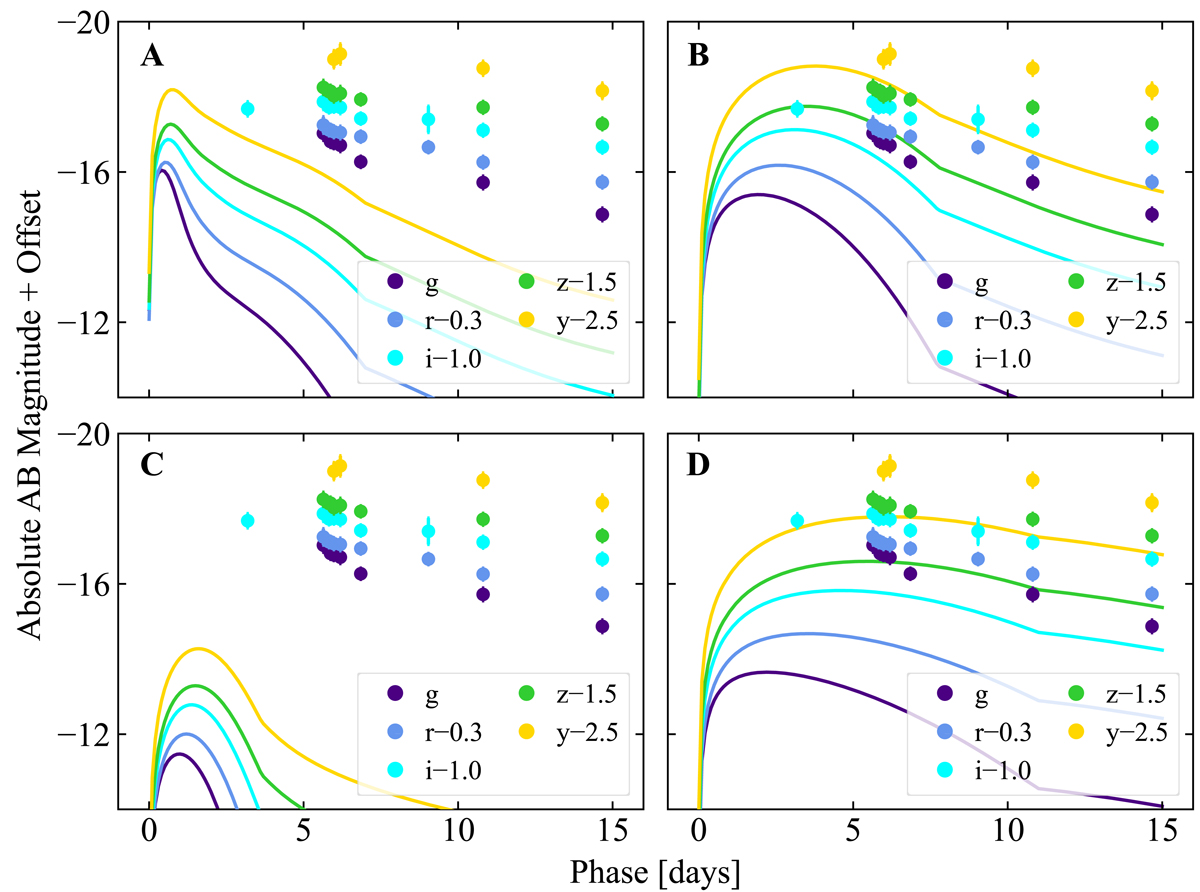
Comparison of kilonova models with SN 2019wxt data. Each panel shows our grizy data of SN 2019wxt (offset by constant magnitude values – reported in the legend – for presentation purposes) together with a kilonova model from Nicholl et al. (2021). A: ‘bright and blue’ case. B: ‘bright and red’. C: ‘highest chirp mass’. D: ‘highest ejecta mass’. The parameters of each model are reported in the text. The phase is with respect to the time of S191213g.
Current usage metrics show cumulative count of Article Views (full-text article views including HTML views, PDF and ePub downloads, according to the available data) and Abstracts Views on Vision4Press platform.
Data correspond to usage on the plateform after 2015. The current usage metrics is available 48-96 hours after online publication and is updated daily on week days.
Initial download of the metrics may take a while.