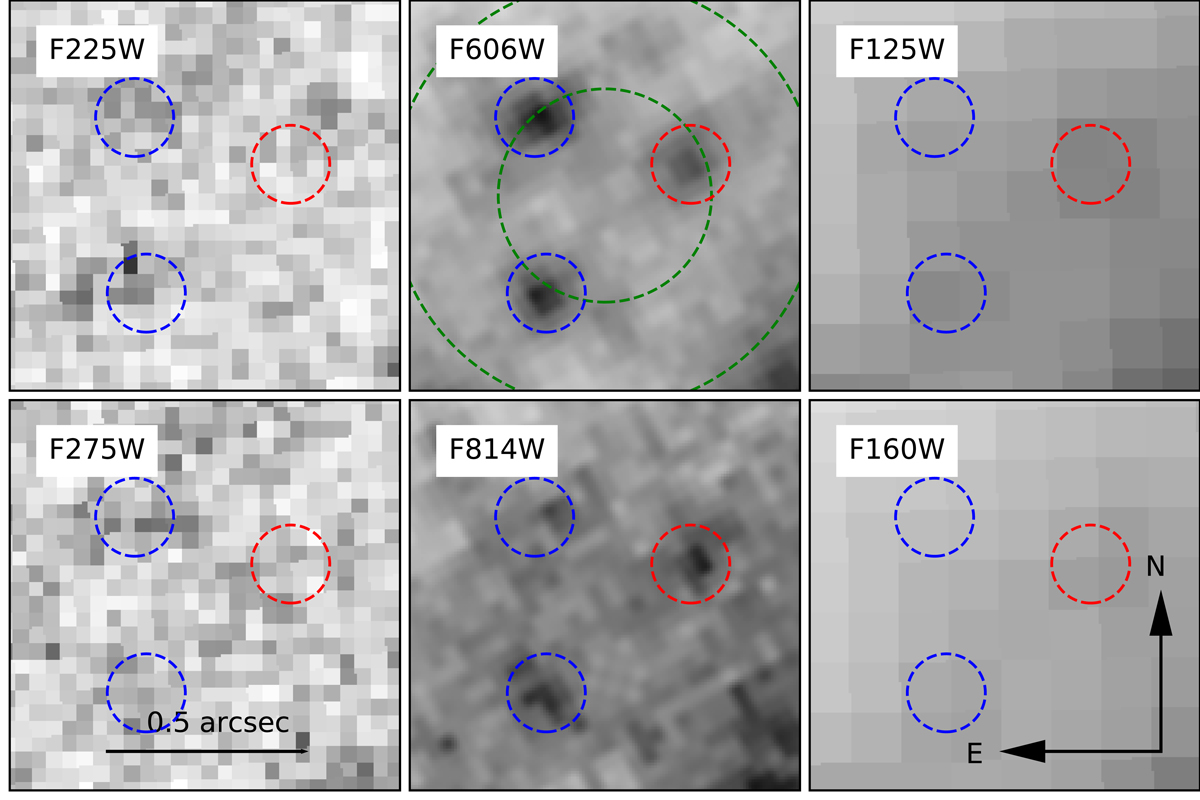
Fig. 11.
Download original image
1″× 1″ cutouts from the late time (Jan 2021) HST imaging of the site of SN 2019wxt. Each panel is centred on the position of SN 2019wxt, filters are indicated in each panel. In the F606W cut-out, the dashed green circles mark a radius of 200 and 400 parsec from SN 2019wxt. The sources discussed in the text are also indicated; the redder source with a red circle, and the two blue sources with blue circles.
Current usage metrics show cumulative count of Article Views (full-text article views including HTML views, PDF and ePub downloads, according to the available data) and Abstracts Views on Vision4Press platform.
Data correspond to usage on the plateform after 2015. The current usage metrics is available 48-96 hours after online publication and is updated daily on week days.
Initial download of the metrics may take a while.