Fig. 1.
Download original image
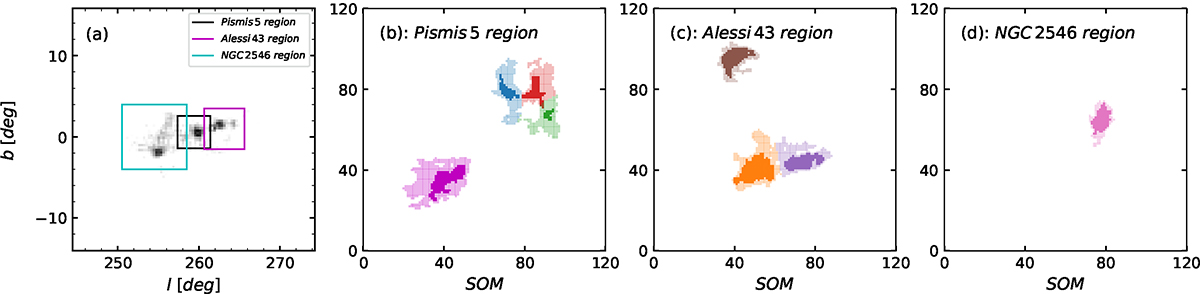
Two-dimensional histogram of Sample 1 in l − b plane and the results from SOM. (a): 2D histogram of the spatial distribution (l − b) of Sample 1, which only shows the bins with overdensities > 3σ. The NGC 2546 region, Pismis 5 region, and Alessi 43 region are each represented by a box in cyan, black, or magenta, respectively. The sources in the cyan, black, and magenta boxes are referred to as Sample 2, Sample 3, and Sample 4. (b), (c), and (d): 2D neural network produced by SOM, showing the neurons with a u value below the 99.85th percentile of the u distribution.
Current usage metrics show cumulative count of Article Views (full-text article views including HTML views, PDF and ePub downloads, according to the available data) and Abstracts Views on Vision4Press platform.
Data correspond to usage on the plateform after 2015. The current usage metrics is available 48-96 hours after online publication and is updated daily on week days.
Initial download of the metrics may take a while.